AWS Just Changed How You Monitor in the Cloud — Here’s What You Need to Know
If you’ve been using AWS CloudWatch for monitoring and wondering whether OpenTelemetry is worth your time, this post is for you. Specifically, it’s written for DevOps engineers, cloud architects, and platform teams who want to modernize their observability setup without ripping everything apart and starting from scratch.
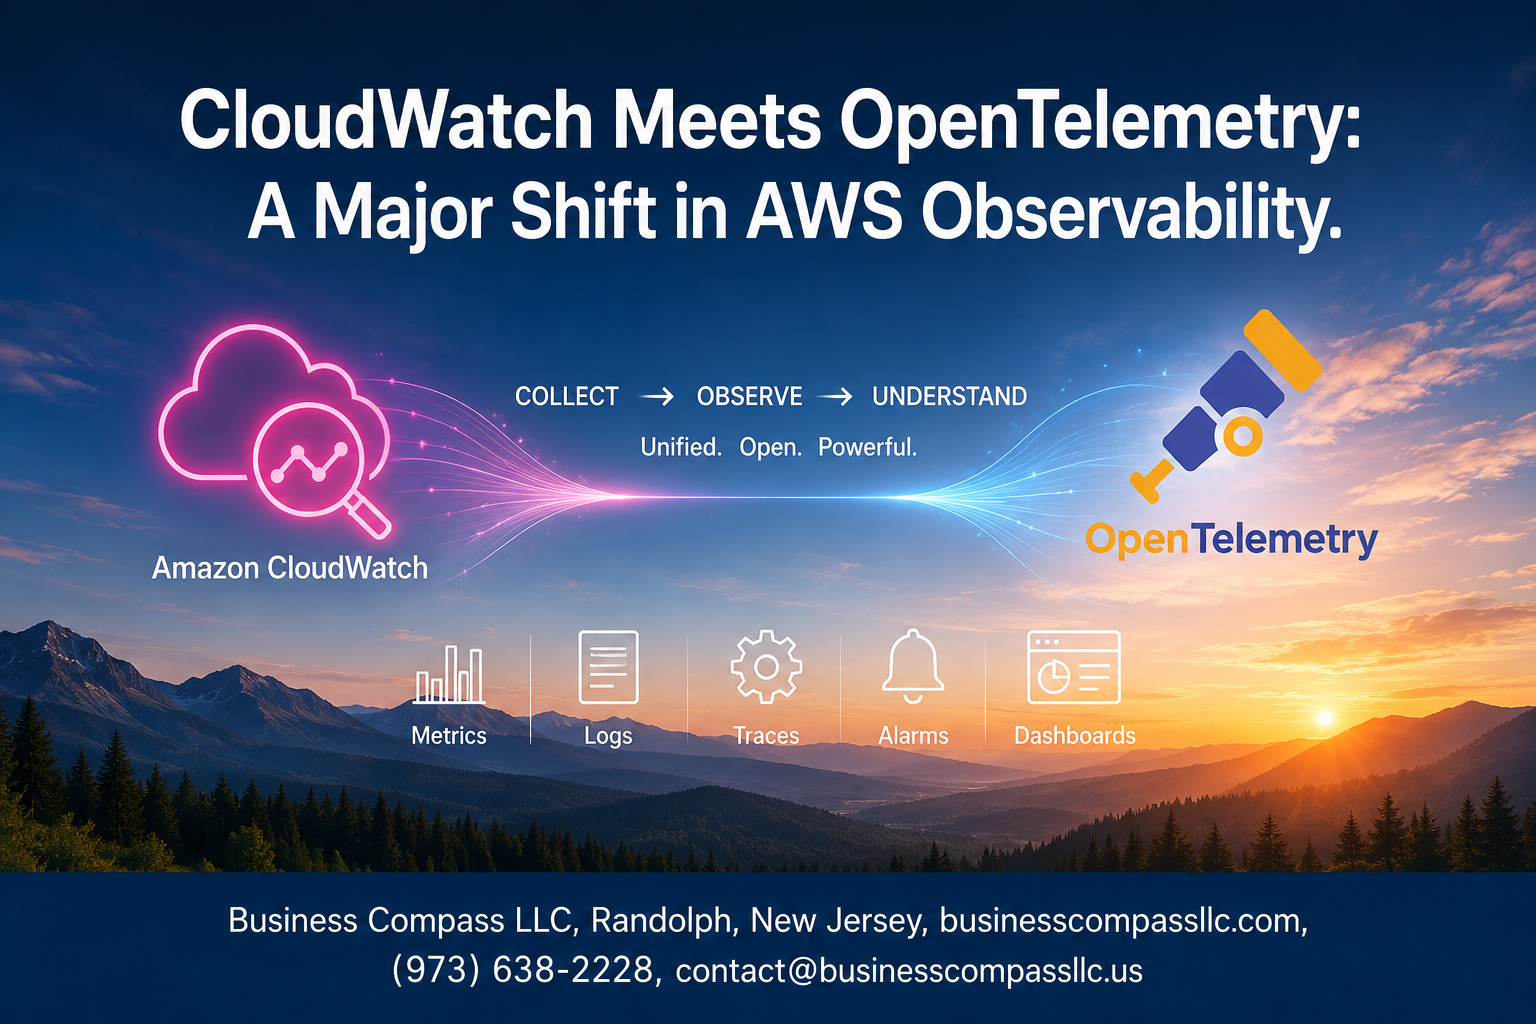
AWS CloudWatch OpenTelemetry integration isn’t just a new feature — it’s a real shift in how AWS thinks about monitoring. And it opens up some genuinely interesting options for teams that care about flexibility, vendor neutrality, and cleaner data across distributed systems.
Here’s what we’ll walk through together:
- What OpenTelemetry actually brings to AWS observability — and why it matters beyond the hype
- How CloudWatch and OpenTelemetry work together in practice — metrics, traces, and how the data flows
- What this means for your team day-to-day — from setup to long-term DevOps best practices
No fluff, no jargon overload. Just a straight look at what changed, why it matters, and how to make it work for your setup.
Understanding the AWS Observability Landscape Before This Shift

The Traditional Role of CloudWatch in AWS Monitoring
CloudWatch has been AWS’s built-in monitoring backbone for years, giving teams a centralized place to collect logs, track metrics, and set alarms across AWS services. It works seamlessly within the AWS ecosystem, making it the go-to choice for teams running workloads entirely on AWS infrastructure.
Key Limitations That Left Teams Wanting More
- Vendor lock-in: CloudWatch ties your observability stack tightly to AWS, making it painful to migrate or adopt a multi-cloud strategy.
- Limited cross-platform visibility: Teams running hybrid or multi-cloud environments struggled to get a unified view since CloudWatch doesn’t play well with non-AWS services.
- Instrumentation overhead: Custom instrumentation required AWS-specific SDKs, meaning any switch in tooling meant rewriting significant chunks of code.
- Fragmented tracing: Distributed tracing through X-Ray felt disconnected from the broader observability picture, especially in complex microservice architectures.
Why OpenTelemetry Emerged as the Industry Standard
OpenTelemetry gave teams a vendor-neutral way to collect metrics, logs, and traces — one standard instrumentation layer that works regardless of where your infrastructure lives. Backed by the CNCF and adopted by major cloud providers, it quickly became the default choice for AWS observability tools in 2024 and beyond. Teams no longer had to choose between flexibility and visibility.
What OpenTelemetry Brings to the Table

Core Components That Make OpenTelemetry Powerful
OpenTelemetry is built around three core pillars that work together seamlessly:
- APIs – Language-specific interfaces for instrumenting your code
- SDKs – Implementations that handle data collection and processing
- Collector – A vendor-agnostic proxy that receives, processes, and exports telemetry data
Vendor-Neutral Data Collection and Its Business Value
One of the biggest headaches with proprietary monitoring tools is lock-in. Once you’re deep into a vendor’s ecosystem, switching costs become painful. OpenTelemetry breaks that cycle by giving you a single instrumentation layer that works across any backend, including AWS CloudWatch OpenTelemetry integration, Datadog, Jaeger, or Prometheus. Your instrumentation code stays the same regardless of where data lands.
How OTel Unifies Metrics, Logs, and Traces in One Framework
Instead of managing three separate tools for three separate signal types, OpenTelemetry pulls metrics, logs, and traces into one cohesive framework. This matters enormously for AWS observability because you get correlated signals — a slow trace links directly to the metric spike and the log error that caused it, without manually stitching data together across disconnected tools.
Real-World Advantages Over Proprietary Monitoring Solutions
- Portability – Move workloads between clouds without re-instrumenting
- Community-driven – Backed by CNCF with contributions from Google, Microsoft, and AWS
- Cost control – Avoid per-agent licensing fees tied to proprietary collectors
- Consistency – Standardized semantic conventions mean cleaner, more predictable data across AWS distributed tracing pipelines
How CloudWatch and OpenTelemetry Work Together

The AWS Distro for OpenTelemetry and Its Purpose
AWS Distro for OpenTelemetry (ADOT) is AWS’s own supported distribution of the OpenTelemetry project. Think of it as a production-ready, AWS-flavored packaging of OTel components — collectors, SDKs, and auto-instrumentation agents — that’s been tested and validated to work reliably inside AWS environments. ADOT handles the heavy lifting of collecting telemetry data from your applications and routing it to multiple backends, including CloudWatch, X-Ray, and third-party tools, all from a single pipeline.
Key things ADOT handles out of the box:
- Auto-instrumentation for Java, Python, JavaScript, and Go applications
- Collector configuration for scraping Prometheus metrics and forwarding OTel traces
- Seamless authentication using IAM roles, so you don’t have to manage credentials manually
Sending OTel Data Directly Into CloudWatch
The AWS CloudWatch OpenTelemetry integration works through the ADOT Collector, which acts as a pipeline between your instrumented services and CloudWatch. You configure exporters inside the collector to push metrics and traces to CloudWatch Metrics and X-Ray respectively. The awsemf exporter, for example, converts OTel metrics into CloudWatch’s Embedded Metric Format (EMF), letting you query and alert on them just like any native CloudWatch metric.
A basic exporter setup looks like this:
- Receivers: otlp (gRPC or HTTP)
- Processors: batch, memory_limiter
- Exporters: awsemf (metrics), awsxray (traces)
This setup means your OpenTelemetry metrics and traces AWS pipelines feed directly into the same dashboards and alarms your team already knows.
Key Integration Points Across AWS Services
The AWS CloudWatch OpenTelemetry integration doesn’t stop at raw metric ingestion. It connects across several AWS services in ways that genuinely change how you monitor distributed systems:
- Amazon ECS and EKS — ADOT runs as a sidecar container or DaemonSet, automatically collecting container-level telemetry without any code changes
- AWS Lambda — Lambda layers wrap your functions with OTel auto-instrumentation, capturing cold starts, invocation durations, and downstream call traces
- AWS X-Ray — Distributed traces collected via OTel SDKs get exported to X-Ray, giving you end-to-end service maps across microservices
- Amazon Managed Service for Prometheus (AMP) — ADOT can scrape Prometheus endpoints and remote-write to AMP, keeping your metrics centralized
- CloudWatch Container Insights — OTel data from containerized workloads feeds directly into Container Insights dashboards for cluster-level visibility
Practical Benefits for Engineering and DevOps Teams

A. Reduced Vendor Lock-In and Lower Switching Costs
One of the biggest wins with AWS CloudWatch OpenTelemetry integration is that your telemetry data is no longer trapped inside a single vendor’s ecosystem. OpenTelemetry’s open standards mean you can collect metrics, logs, and traces once and route them anywhere — CloudWatch today, another backend tomorrow — without rewriting your instrumentation from scratch.
- No proprietary SDKs tying your codebase to AWS-specific libraries
- Freedom to evaluate or adopt alternative observability platforms without a full migration effort
- Reduced long-term costs tied to renegotiating vendor contracts or retraining teams on new tooling
B. Faster Troubleshooting With Unified Observability Signals
When metrics, traces, and logs speak the same language through OpenTelemetry AWS observability, correlating an alert to its root cause becomes dramatically faster. Instead of jumping between disconnected dashboards, engineers get a single coherent picture of what’s happening across services.
- Distributed traces connect a slow API response directly to a downstream database query
- Correlated log context sits right alongside trace data, cutting mean time to resolution (MTTR)
- CloudWatch’s native integration surfaces AWS distributed tracing OpenTelemetry data without extra stitching
C. Simplified Instrumentation Across Multi-Cloud Environments
Teams running workloads across AWS, GCP, or Azure no longer need separate instrumentation strategies per cloud. OpenTelemetry’s vendor-neutral collectors and SDKs give you a consistent way to gather telemetry everywhere, with CloudWatch acting as one of several possible destinations.
- A single OTel Collector configuration handles data from containers running on EKS, GKE, or AKS
- Shared instrumentation libraries reduce onboarding friction for engineers switching between cloud environments
- Cloud monitoring open standards cut down the operational overhead of maintaining multiple agents and exporters
D. Cost Optimization Through Smarter Data Collection
Raw telemetry volume is expensive. OpenTelemetry gives DevOps teams precise control over what gets collected, sampled, and exported — which directly impacts your CloudWatch bill.
- Tail-based sampling lets you capture only the traces that actually matter, like errors or slow requests
- Filtering and aggregating metrics at the collector level before they hit CloudWatch reduces ingestion costs
- Teams following OpenTelemetry DevOps best practices report meaningful reductions in data storage and processing spend by trimming high-cardinality noise early in the pipeline
E. Improved Collaboration Between Dev, Ops, and Platform Teams
Shared tooling creates shared understanding. When everyone — developers, SREs, and platform engineers — works from the same OpenTelemetry metrics and traces AWS setup, conversations about system health get a lot less political and a lot more productive.
- Developers instrument their own services using standard OTel SDKs without waiting on ops to wire up custom agents
- Platform teams manage one centralized OTel Collector configuration instead of juggling per-team monitoring setups
- Ops engineers get consistent data formats that make writing CloudWatch alarms and dashboards far more predictable across services
Getting Started With CloudWatch and OpenTelemetry
Choosing the Right Instrumentation Strategy for Your Stack
Picking the right instrumentation approach depends on what your stack looks like today. If you’re running microservices in EKS or ECS, auto-instrumentation libraries for Java, Python, or Node.js get you traces and metrics fast without touching your application code. For custom business logic or internal SDKs, manual instrumentation gives you much finer control over what gets captured.
- Auto-instrumentation: Best for quick wins — drop in the OTel agent and start collecting data immediately
- Manual instrumentation: Ideal when you need custom spans, specific attributes, or business-level metrics
- Hybrid approach: Combine both — auto for infrastructure-level signals, manual for application-specific events
Configuring the OTel Collector for AWS Environments
The AWS Distro for OpenTelemetry (ADOT) Collector is your best starting point for CloudWatch OpenTelemetry setup in AWS environments. It’s a pre-configured, AWS-supported distribution of the OTel Collector that ships data directly to CloudWatch, X-Ray, and Amazon Managed Service for Prometheus.
- Deploy the ADOT Collector as a sidecar container in ECS or as a DaemonSet in EKS
- Configure the
awsemfexporter to convert OTel metrics into CloudWatch Embedded Metric Format (EMF) - Use the
awsxrayexporter to send AWS distributed tracing OpenTelemetry data straight into X-Ray - Set up pipelines in the collector config to route different signal types — metrics, traces, logs — to the right destinations
A minimal collector config looks something like this:
receivers:
  otlp:
    protocols:
      grpc:
exporters:
  awsemf:
    region: us-east-1
  awsxray:
    region: us-east-1
service:
  pipelines:
    metrics:
      receivers: [otlp]
      exporters: [awsemf]
    traces:
      receivers: [otlp]
      exporters: [awsxray]
Setting Up Dashboards and Alerts in CloudWatch With OTel Data
Once your OpenTelemetry metrics and traces AWS pipeline is running, CloudWatch dashboards pull that data in just like any native metric. The EMF exporter creates custom metric namespaces automatically, so you can filter and graph them right away.
- Head to CloudWatch > Metrics and look for your custom namespace (e.g.,
ECS/ContainerInsightsor whatever you defined in the EMF exporter config) - Build widgets using OTel-generated metrics like request latency, error rates, and throughput
- Set up CloudWatch Alarms on those metrics with standard threshold or anomaly detection models
- Link traces in X-Ray to specific metric spikes using CloudWatch ServiceLens — this is where the real power of AWS CloudWatch OpenTelemetry integration shows up, connecting the dots between a latency alarm and the exact trace causing it
For teams aiming at OpenTelemetry DevOps best practices, tagging your OTel resources consistently — environment, service name, version — makes filtering dashboards dramatically easier down the road.
What This Shift Means for the Future of AWS Monitoring

A. AWS Commitment to Open Standards and What It Signals
AWS going all-in on OpenTelemetry isn’t just a product update — it’s a clear sign that the cloud giant is betting on community-driven standards over proprietary lock-in. The AWS CloudWatch OpenTelemetry integration tells engineering teams that interoperability is now a first-class priority, not an afterthought.
- AWS has contributed directly to the OpenTelemetry project, including maintaining the AWS Distro for OpenTelemetry (ADOT)
- Native support signals that vendor-neutral telemetry pipelines will be a core part of the AWS ecosystem going forward
- Teams running multi-cloud or hybrid environments get a real, practical path to unified observability without rebuilding everything from scratch
B. Anticipated Improvements and Upcoming AWS Observability Features
The AWS observability shift toward open standards opens the door to some genuinely exciting capabilities on the horizon:
- Deeper OTLP support natively within CloudWatch, reducing the need for custom translation layers
- Smarter anomaly detection tied directly to OpenTelemetry metrics and traces on AWS
- Tighter integration between CloudWatch, AWS X-Ray, and third-party backends like Grafana and Jaeger
- Expanded support for AWS distributed tracing with OpenTelemetry across serverless, containers, and EC2 workloads
C. How Teams Can Stay Ahead of the Observability Curve
Staying current with cloud monitoring open standards doesn’t mean chasing every new release — it means building smart habits:
- Adopt ADOT now rather than waiting for perfect feature parity; the ecosystem is mature enough for production use
- Follow the OpenTelemetry project’s roadmap and AWS blog for updates on AWS observability tools
- Design your telemetry pipelines to be backend-agnostic from day one, so switching or adding destinations requires minimal rework
- Train your DevOps teams on OpenTelemetry DevOps best practices — instrumentation, context propagation, and semantic conventions especially

AWS has made a bold move by bringing OpenTelemetry into the CloudWatch ecosystem, and the impact is hard to ignore. Teams no longer have to juggle fragmented tools or get locked into rigid, vendor-specific setups. With open standards at the core, collecting, sending, and making sense of telemetry data across distributed systems becomes a much smoother experience. The practical wins for engineering and DevOps teams are real — faster troubleshooting, cleaner instrumentation, and the flexibility to work across multiple cloud environments without starting from scratch every time.
If you haven’t started exploring this combination yet, now is a great time to dig in. Start small, maybe with a single service or workload, get familiar with how the two work together, and build from there. The shift toward open, interoperable observability isn’t just a trend — it’s quickly becoming the new standard for how modern teams keep their systems healthy and performant. Getting ahead of it now puts your team in a much stronger position down the road.