Building observable ML pipelines transforms chaotic machine learning workflows into transparent, debuggable systems that teams can actually trust in production. Without proper ML pipeline observability, data scientists and MLOps engineers spend countless hours playing detective when models fail, data drift occurs, or performance suddenly tanks.
This guide is designed for data scientists, machine learning engineers, and DevOps teams who need practical strategies for monitoring their ML systems end-to-end. We’ll show you how to move beyond basic model accuracy tracking to build comprehensive machine learning monitoring that catches issues before they impact users.
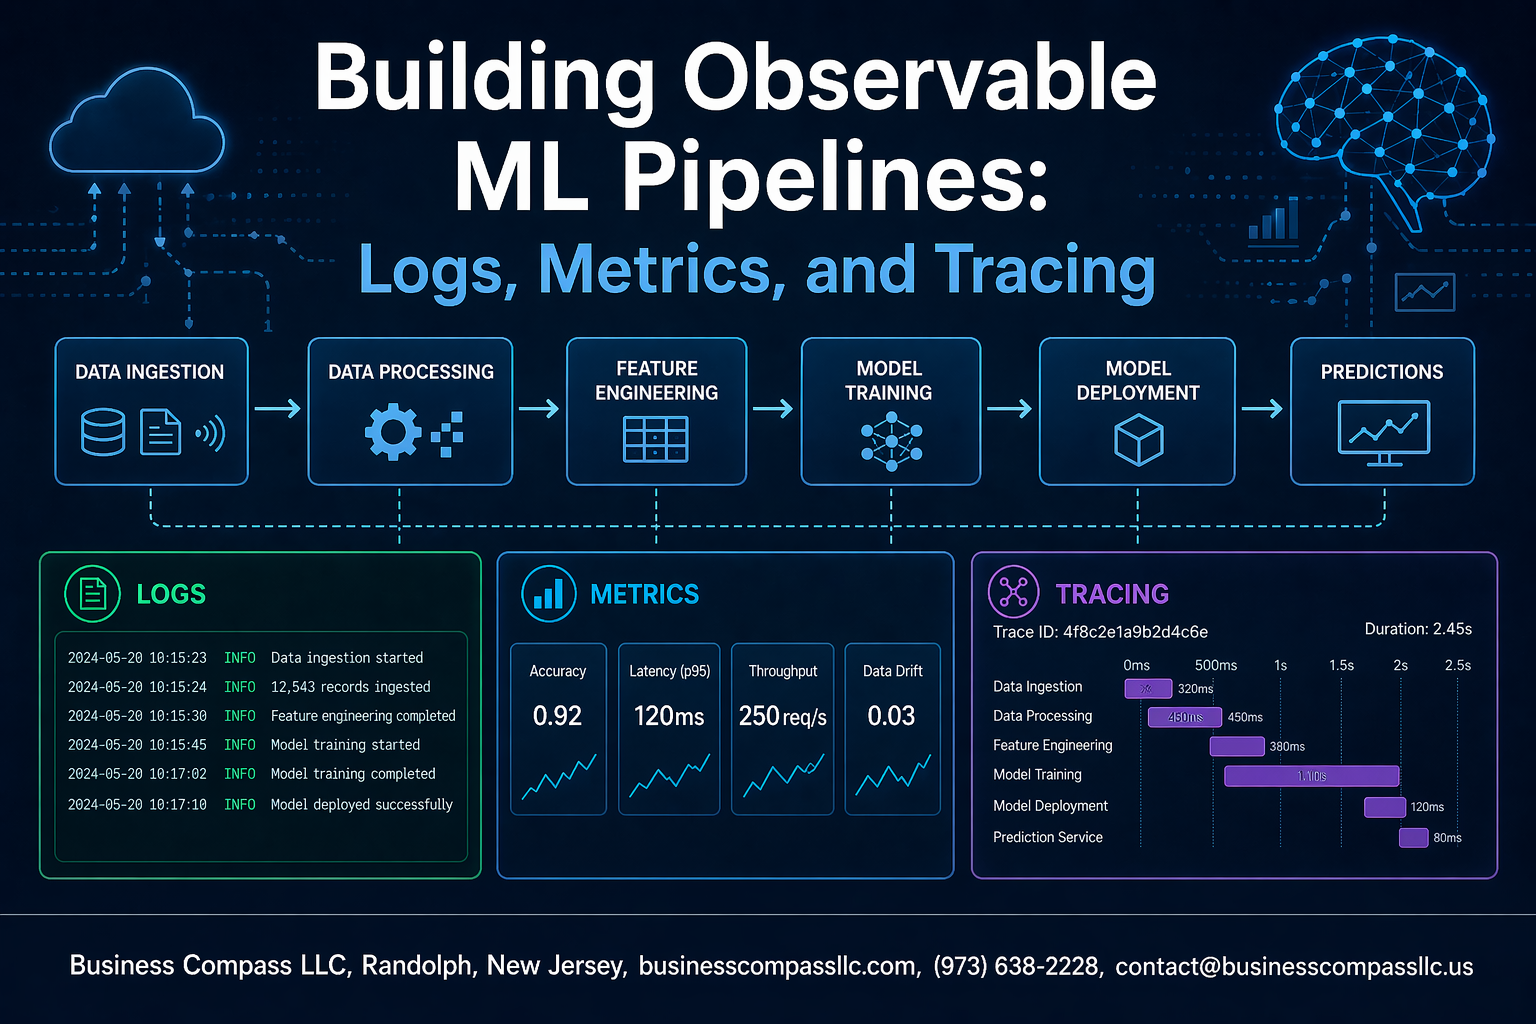
We’ll walk through the three pillars of observable ML systems: structured MLOps logging that captures every decision your pipeline makes, robust ML metrics collection that tracks both technical performance and business impact, and distributed tracing machine learning workflows to understand how data flows through complex, multi-service architectures. You’ll also learn how to set up intelligent MLOps alerting that cuts through the noise and helps your team respond quickly when things go wrong.
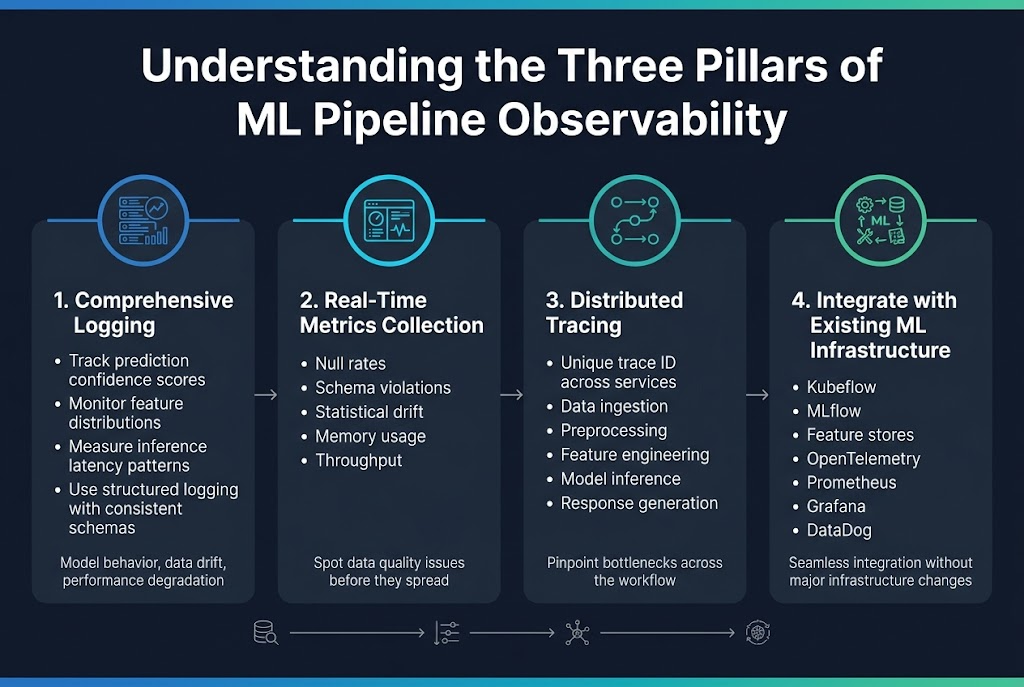
Understanding the Three Pillars of ML Pipeline Observability
Define comprehensive logging strategies for model performance tracking
ML pipeline observability starts with smart logging that captures what matters most – model behavior, data drift, and performance degradation. Think beyond basic error logs and track prediction confidence scores, feature distributions, and inference latency patterns. Structured logging with consistent schemas across your pipeline components makes debugging faster when models start acting weird.
Implement real-time metrics collection for data quality monitoring
Real-time metrics collection gives you the pulse of your ML systems as they process data streams. Monitor data quality metrics like null rates, schema violations, and statistical drift alongside infrastructure metrics like memory usage and throughput. Dashboard these metrics to spot problems before they cascade through your pipeline and ruin model accuracy.
Establish distributed tracing across pipeline components
Distributed tracing connects the dots when requests flow through multiple services, from data ingestion to model serving. Each request gets a unique trace ID that follows it through preprocessing, feature engineering, model inference, and response generation. This visibility helps you pinpoint bottlenecks and understand how delays in one component affect the entire workflow.
Integrate observability tools with existing ML infrastructure
Your observability stack needs to play nice with MLOps tools like Kubeflow, MLflow, and feature stores. Use standard protocols like OpenTelemetry to collect telemetry data and send it to tools like Prometheus, Grafana, or DataDog. The goal is seamless integration that doesn’t require major infrastructure changes or disrupt existing workflows.
Designing Effective Logging Systems for Machine Learning Workflows
Structure Logs for Model Training and Inference Visibility
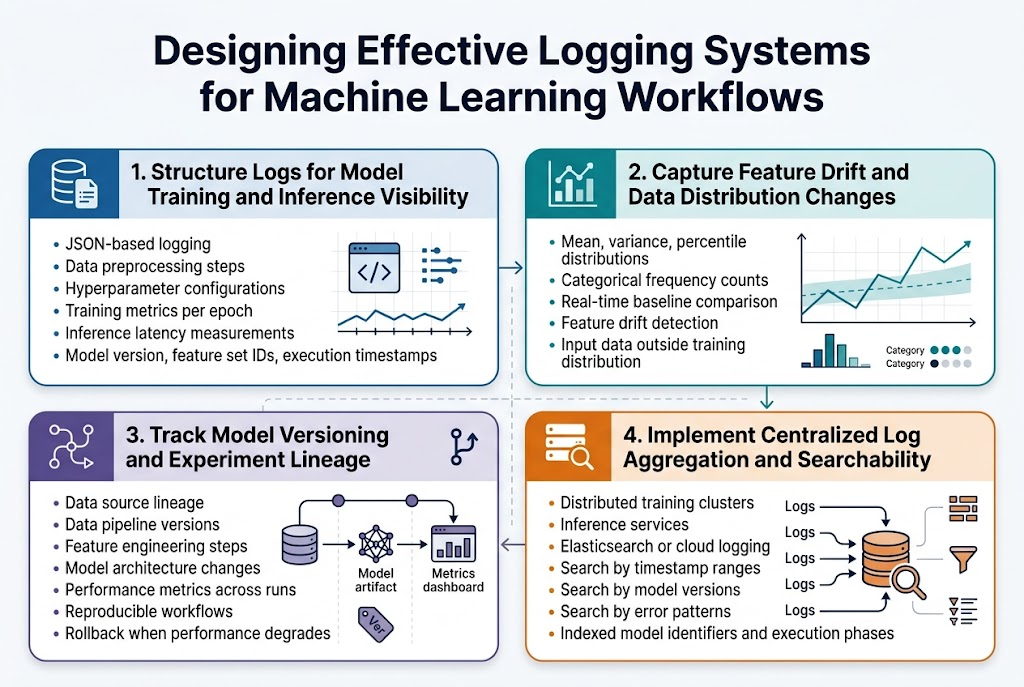
Effective MLOps logging starts with structured log formats that capture both training and inference events. JSON-based logging provides consistent schema for data preprocessing steps, hyperparameter configurations, training metrics per epoch, and inference latency measurements. Include essential metadata like model version, feature set identifiers, and execution timestamps to enable comprehensive ML pipeline debugging.
Capture Feature Drift and Data Distribution Changes
Machine learning monitoring requires dedicated logging for feature distribution tracking and drift detection. Log statistical summaries of input features, including mean, variance, and percentile distributions for numerical features, plus category frequency counts for categorical variables. Real-time comparison against baseline distributions helps identify when models encounter data outside their training distribution.
Track Model Versioning and Experiment Lineage
Comprehensive experiment tracking logs maintain complete lineage from data sources through model artifacts. Record data pipeline versions, feature engineering steps, model architecture changes, and performance metrics across different experiment runs. This approach enables reproducible ML workflows and simplifies rollback procedures when model performance degrades.
Implement Centralized Log Aggregation and Searchability
Observable ML systems demand centralized logging infrastructure that aggregates logs from distributed training clusters and inference services. Tools like Elasticsearch or cloud-native logging services provide powerful search capabilities across timestamp ranges, model versions, and error patterns. Proper indexing strategies on model identifiers and execution phases accelerate troubleshooting during ML pipeline health monitoring incidents.
Building Robust Metrics Collection for ML Pipeline Health
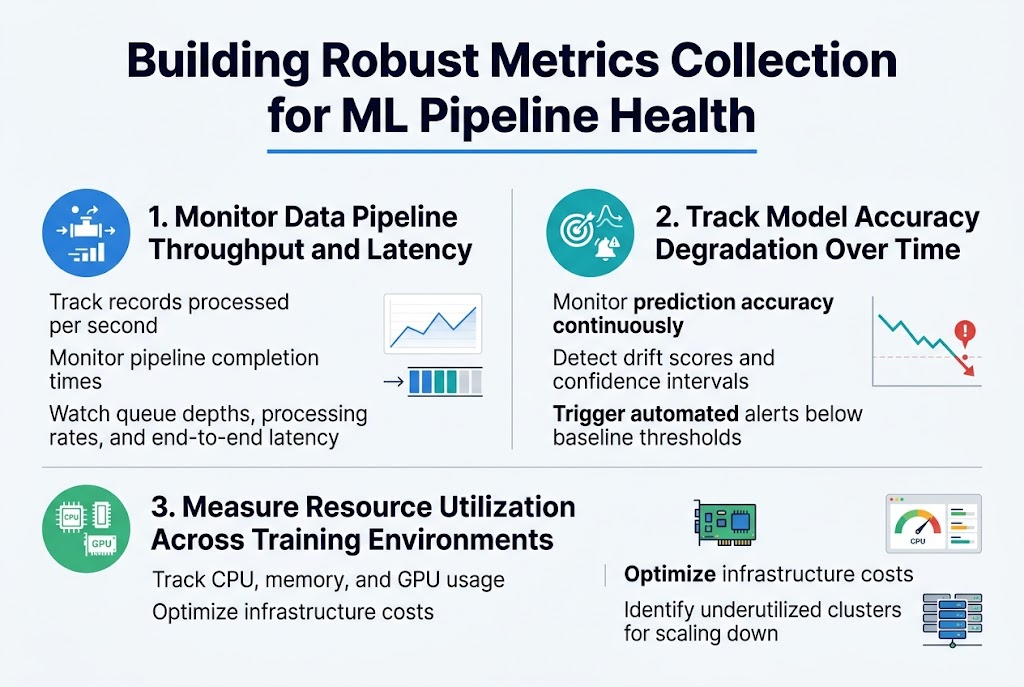
Monitor Data Pipeline Throughput and Latency
Tracking throughput metrics like records processed per second and pipeline completion times reveals bottlenecks before they impact production. Set up dashboards monitoring queue depths, processing rates, and end-to-end latency across each pipeline stage.
Track Model Accuracy Degradation Over Time
ML metrics collection requires continuous monitoring of prediction accuracy, drift detection scores, and confidence intervals. Implement automated alerts when performance drops below baseline thresholds, enabling rapid response to data quality issues.
Measure Resource Utilization Across Training Environments
Monitor CPU, memory, and GPU usage patterns during model training to optimize infrastructure costs. Track resource allocation efficiency and identify underutilized clusters that can be scaled down while maintaining ML pipeline health.
Implementing Distributed Tracing for Complex ML Systems
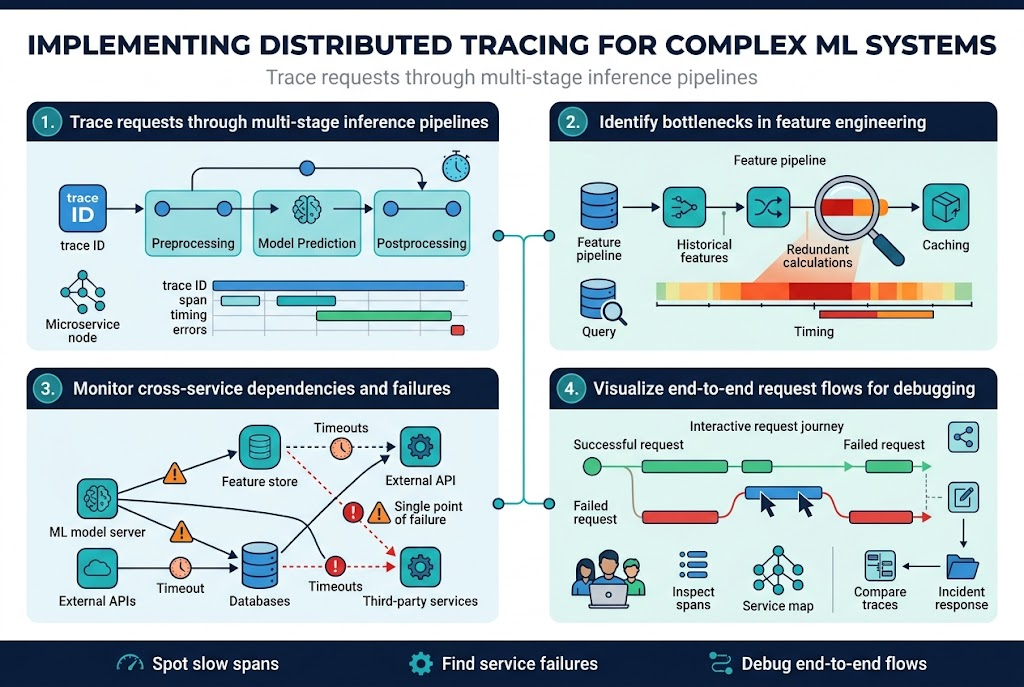
Trace requests through multi-stage inference pipelines
Distributed tracing transforms complex ML inference pipelines into transparent, trackable workflows where every request gets a unique trace ID that follows data through preprocessing, model prediction, and postprocessing stages. Modern tracing tools like Jaeger and Zipkin capture timing data, service interactions, and error states across microservices, making it simple to spot where requests slow down or fail. Each span represents a specific operation – feature extraction, model inference, or result formatting – creating a detailed map of your ML pipeline’s execution path.
Identify bottlenecks in feature engineering processes
Feature engineering often becomes the hidden performance killer in ML systems, and distributed tracing machine learning workflows reveals exactly where computational resources get wasted. Trace data shows which feature transformations consume excessive time, whether database queries for historical features create delays, or if parallel processing isn’t working effectively. Smart teams use trace analysis to optimize feature pipelines by identifying redundant calculations, inefficient data joins, and memory-intensive operations that could benefit from caching or restructuring.
Monitor cross-service dependencies and failures
ML systems depend on external APIs, databases, and third-party services that can fail unpredictably, causing cascading issues throughout your observable ML systems. Distributed tracing captures these service interactions, showing dependency graphs that highlight single points of failure and timeout patterns. When a recommendation engine starts returning stale results, traces quickly reveal whether the issue stems from a slow feature store, an overloaded model server, or network latency between services.
Visualize end-to-end request flows for debugging
Visual trace representations turn abstract ML pipeline debugging into concrete problem-solving by displaying request journeys as interactive timelines and service maps. Engineers can click through traces to examine specific spans, compare successful requests against failed ones, and understand how errors propagate through distributed systems. These visualizations become invaluable during incident response, allowing teams to quickly grasp complex interactions and share findings with stakeholders who need clear explanations of ML pipeline health monitoring issues.
Alerting and Incident Response for ML Pipeline Failures
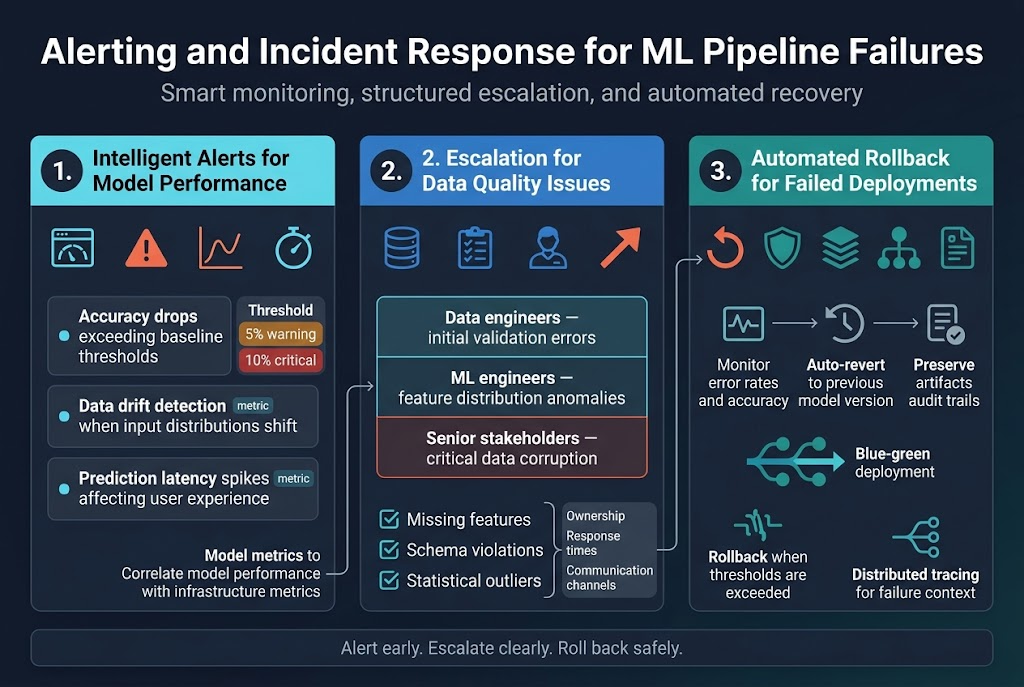
Configure intelligent alerts for model performance degradation
Smart alerting for ML pipeline observability requires monitoring key performance indicators that directly impact business outcomes. Set up alerts for accuracy drops exceeding baseline thresholds, data drift detection when input distributions shift significantly, and prediction latency spikes that affect user experience. Configure multi-threshold alerts that trigger warnings at 5% performance degradation and critical alerts at 10% drops. MLOps alerting systems should integrate with your existing monitoring stack to correlate model performance with infrastructure metrics.
Establish escalation procedures for data quality issues
Data quality incidents in machine learning workflows demand structured response procedures. Create tiered escalation paths where data engineers handle initial validation errors, ML engineers address feature distribution anomalies, and senior stakeholders get involved for critical data corruption issues. Implement automated checks for missing features, schema violations, and statistical outliers. Your escalation matrix should define clear ownership, response time expectations, and communication channels to ensure rapid resolution of data quality problems that could cascade through your ML pipeline health monitoring systems.
Automate rollback mechanisms for failed deployments
Automated rollback capabilities serve as safety nets when ML deployments fail in production environments. Design circuit breakers that automatically revert to previous model versions when error rates exceed acceptable limits or when prediction accuracy falls below predefined thresholds. Implement blue-green deployment strategies where traffic gradually shifts to new models while monitoring performance metrics. Your rollback automation should preserve model artifacts, maintain audit trails, and integrate with distributed tracing machine learning systems to capture detailed failure context for post-incident analysis.
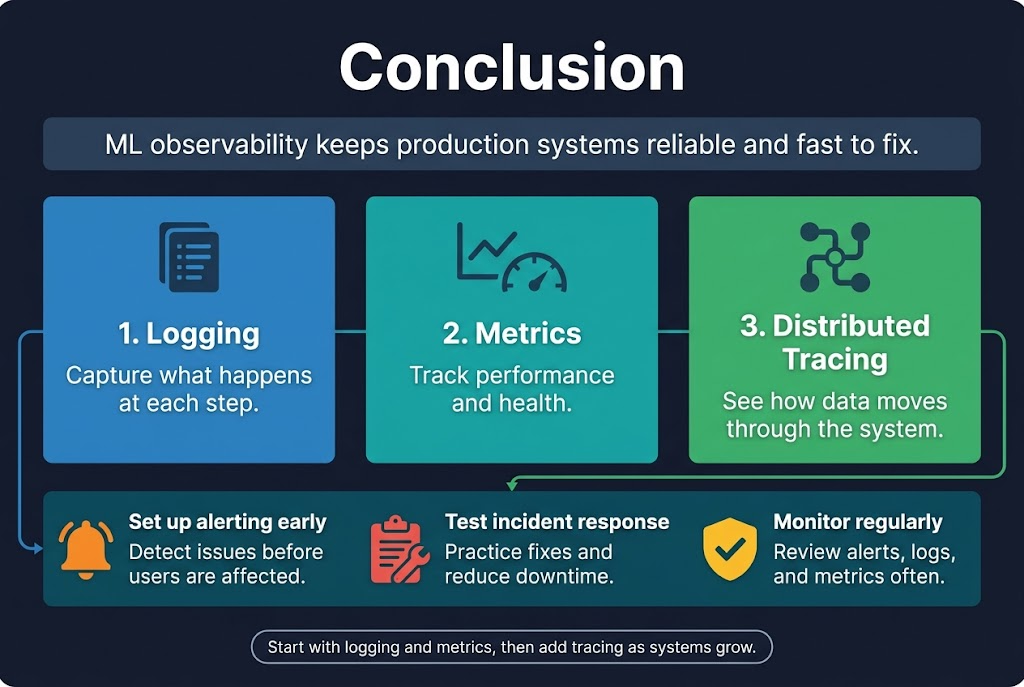
Machine learning pipelines are complex beasts that need constant monitoring to work reliably in production. Getting your observability right means setting up proper logging to capture what’s happening at each step, collecting the right metrics to track performance and health, and using distributed tracing to see how data flows through your entire system. When something goes wrong – and it will – having solid alerting and incident response processes can mean the difference between a quick fix and hours of downtime.
The three pillars of observability work together to give you complete visibility into your ML operations. Start with basic logging and metrics collection, then add distributed tracing as your systems grow more complex. Don’t wait until you have a production incident to build these monitoring systems. Set them up early, test your alerts regularly, and make sure your team knows how to respond when things break. Your future self will thank you when you can quickly spot and fix issues before they impact your users.