

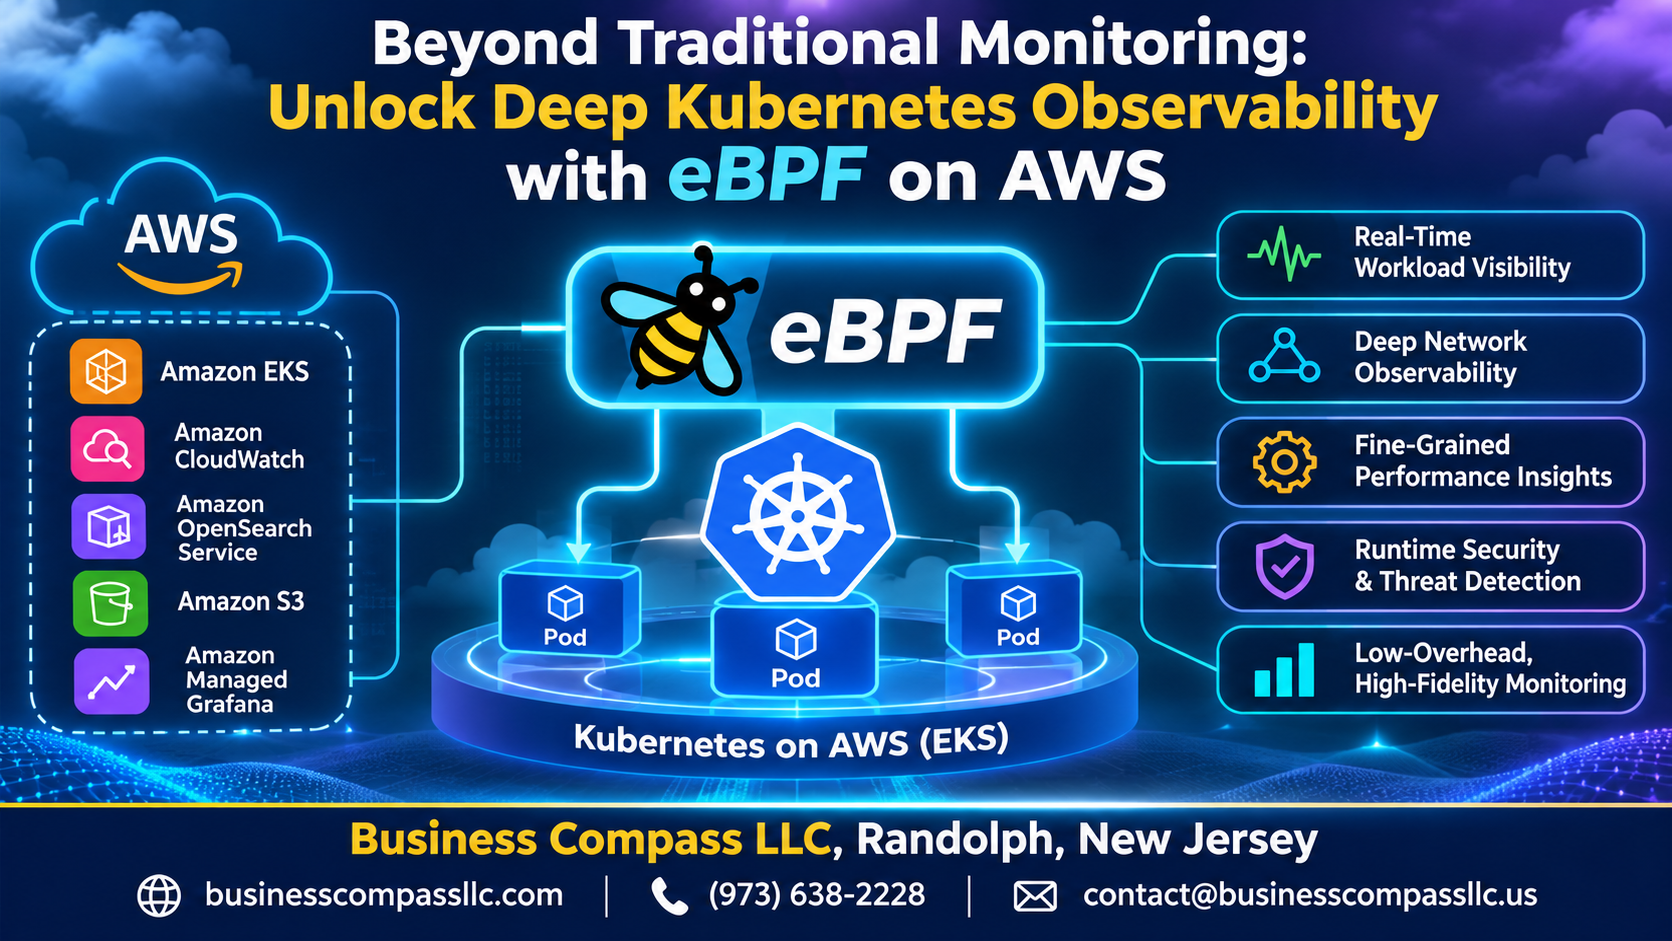
Beyond Traditional Monitoring: Unlock Deep Kubernetes Observability with eBPF on AWS
If you’re running Kubernetes in production on AWS and your monitoring setup still feels like you’re flying blind, you’re not alone. Traditional tools give you surface-level metrics — CPU usage, memory consumption, pod restarts — but they miss what’s actually happening inside your cluster. When something breaks at 2 AM, those numbers rarely tell you why.
This guide is for platform engineers, DevOps teams, and SREs who manage Kubernetes workloads on AWS and need more than dashboards that look good but deliver little signal when it matters most.
Here’s what we’ll cover:
- Why traditional Kubernetes monitoring falls short — and the blind spots it leaves in your production environment
- What eBPF brings to Kubernetes observability — how this Linux kernel technology gives you deep, real-time visibility into network traffic, system calls, and application behavior without touching your code
- How to run eBPF-powered observability on AWS — including practical steps to build a production-ready stack that delivers actionable Kubernetes metrics your team can actually use
By the end, you’ll have a clear picture of how eBPF Kubernetes tools fit into your AWS environment and what it takes to move from reactive firefighting to genuinely understanding what your cluster is doing.
Why Traditional Kubernetes Monitoring Falls Short

The Hidden Blind Spots in Metrics-Only Approaches
Traditional Kubernetes observability relies on CPU, memory, and request-rate metrics—missing syscall-level activity, network flows, and process behavior entirely.
The Cost of Delayed Incident Detection
Slow alerting means cascading failures across microservices before anyone notices.
Why Black-Box Monitoring Fails Microservices
No visibility into inter-service communication = blind troubleshooting.
What eBPF Brings to Kubernetes Observability

Kernel-Level Visibility Without Intrusive Instrumentation
eBPF hooks directly into the Linux kernel, giving you deep Kubernetes insights across network traffic, system calls, and performance metrics — all without touching application code or deploying sidecars. This makes eBPF monitoring dramatically lighter and more powerful than traditional agents, delivering real-time telemetry with near-zero overhead across your entire cluster.
Running eBPF-Powered Observability on AWS

Choosing the Right AWS Services and Node Configurations for eBPF
Run eBPF monitoring on Amazon EKS using AL2 or Bottlerocket nodes — both support kernel 5.10+.
Kernel Version and OS Requirements on Amazon EKS
- Minimum kernel: 5.4 (5.10+ recommended)
Deploying eBPF Tools Across Managed and Self-Managed Node Groups
- Use DaemonSets for cluster-wide eBPF coverage
Gaining Actionable Insights with eBPF in Kubernetes

Tracing Service-to-Service Latency at the Network Level
eBPF captures real kernel-level timing between pods, exposing hidden latency spikes traditional monitoring misses entirely.
Detecting Anomalous Process and Syscall Behavior
Unusual syscall patterns trigger instant alerts, catching threats before they escalate.
Mapping Live Kubernetes Traffic
Zero-configuration service maps update automatically as workloads shift.
Correlating with CloudWatch and Prometheus
eBPF data enriches existing metrics, cutting root cause analysis time dramatically across distributed AWS workloads.
Implementing a Production-Ready eBPF Observability Stack

Selecting the Right eBPF Tools for Your AWS Environment
- Prefer Cilium or Pixie for native AWS Kubernetes observability integration.
Scaling Collection Without Overloading Clusters
- Use sampling strategies to manage data volume.
Security Guardrails
- Restrict eBPF programs via RBAC and admission controllers.
Measuring ROI
- Track MTTR reduction against overhead costs.

Kubernetes environments are complex, and traditional monitoring tools simply weren’t built to keep up. eBPF changes the game by giving you deep, real-time visibility into what’s actually happening inside your cluster — without the overhead or blind spots that come with older approaches. When you run this on AWS, you get the added benefit of a rock-solid infrastructure that supports eBPF-powered tools at scale, making it easier to turn raw data into insights you can actually act on.
If you’re serious about keeping your Kubernetes workloads healthy and performant, building a production-ready eBPF observability stack isn’t just a nice-to-have — it’s the logical next step. Start by identifying the gaps in your current monitoring setup, explore the eBPF-based tools that fit your AWS environment, and gradually build out a stack that gives your team the visibility it needs to catch problems before they become outages. The deeper you look, the better decisions you’ll make.