

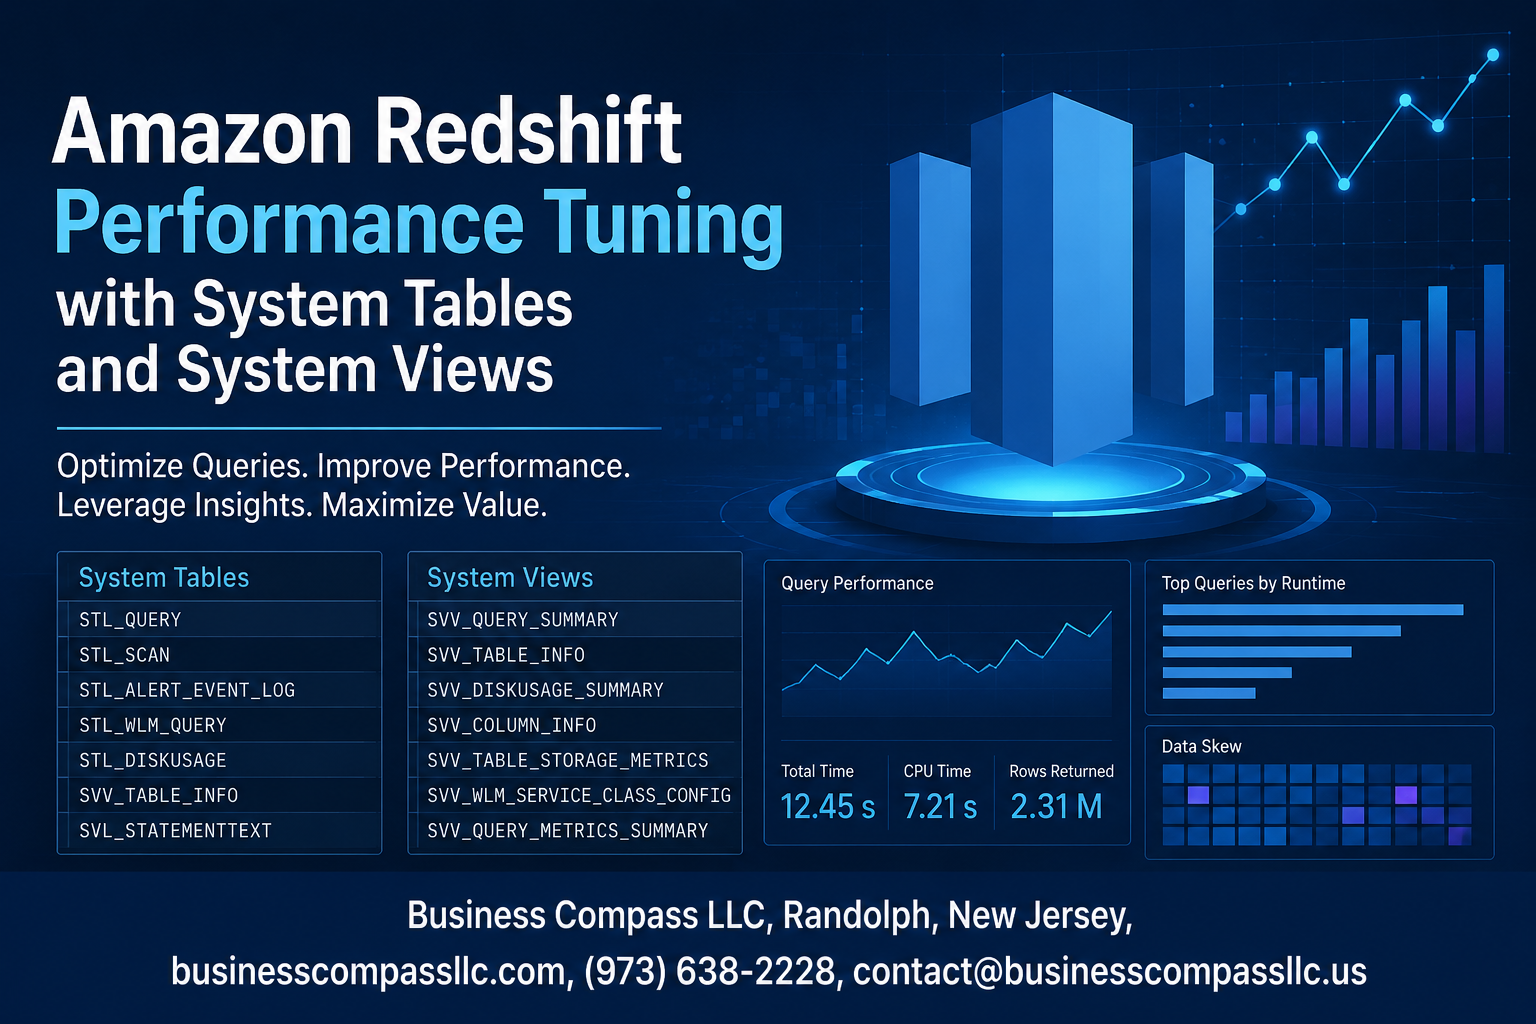
Stop Guessing Why Your Redshift Queries Are Slow
If your Amazon Redshift queries are crawling and you’re not sure where to start, you’re in the right place. This guide is for data engineers, analytics engineers, and DBAs who already work with Redshift and want to go beyond the basics to actually fix performance problems — not just throw more compute at them.
We’ll dig into how Redshift system tables and system views give you a real-time look at what’s happening inside your cluster. From there, you’ll see how to run Redshift query performance diagnosis using built-in metadata, so you can spot bottlenecks without guessing. We’ll also cover Redshift data distribution optimization and table design decisions that quietly kill performance, plus how Redshift workload management and the vacuum and analyze process keep your cluster from falling apart over time.
No fluff, no vague advice — just practical Amazon Redshift performance tuning you can apply right away.
Understanding Amazon Redshift System Tables and System Views

Key Differences Between System Tables and System Views
- System tables (STL, STV) store raw logs and snapshots
- System views (SVV, SVL) combine data for easier querying
How System Tables Store Query and Workload Metadata
STL tables log completed query history; STV tables capture real-time cluster snapshots for Amazon Redshift performance tuning.
Essential System Views for Real-Time Performance Monitoring
SVV_TABLE_INFO and SVL_QUERY_SUMMARY simplify Redshift cluster monitoring.
Navigating the STL, STV, and SVV Table Categories
- STL: Historical logs
- STV: Live snapshots
- SVV: Cross-referenced metadata views
Diagnosing Query Performance Issues with System Tables
Using STL_QUERY to Track Query Execution History
Query history lives in STL_QUERY. Filter by userid or starttime to spot slow queries fast.
Identifying Long-Running Queries with STL_WLM_QUERY
Check exec_time in STL_WLM_QUERY to catch runtime outliers.
Detecting Disk-Based Operations Through STL_ALERT_EVENT_LOG
- Look for
disk-basedalerts signaling memory spills
Analyzing Query Wait Times with STV_WLM_QUERY_STATE
Queue wait times reveal WLM bottlenecks instantly.
Pinpointing Bottlenecks Using STL_EXPLAIN
Read STL_EXPLAIN plan steps to catch costly hash joins or sequential scans hurting Redshift query optimization.
Optimizing Table Design and Data Distribution

Evaluating Distribution Key Effectiveness with SVV_TABLE_INFO
Query SVV_TABLE_INFO to check diststyle and sortkey1 columns, spotting tables missing proper distribution keys.
Reducing Data Skew by Analyzing STV_BLOCKLIST
Uneven block counts across slices signal skew — fix by switching to a high-cardinality distribution key.
Improving Sort Key Selection with STL_SCAN Insights
High rows vs. rows_pre_filter ratios in STL_SCAN mean your sort key isn’t filtering efficiently.
Boosting Workload Management Efficiency
Monitoring Queue Depths and Slot Usage via STV_WLM_SERVICE_CLASS_STATE
Query STV_WLM_SERVICE_CLASS_STATE to check active slots and queue depths in real time. Pair those insights with SVL_QUERY_METRICS to spot queuing bottlenecks, then tweak concurrency settings and WLM rules to prioritize critical queries—keeping your Redshift workload management running smoothly without unnecessary wait times.
Accelerating Query Execution with Vacuum and Analyze

Identifying Tables That Need Vacuuming via SVV_VACUUM_SUMMARY
Query SVV_VACUUM_SUMMARY to spot tables with high deleted-row percentages — these hurt Redshift query optimization badly.
Measuring the Impact of Stale Statistics on Query Plans
Check SVV_TABLE_INFO for stats_off values above 10%; outdated stats push the planner toward slow, inefficient execution paths.
Automating Analyze Operations for Consistent Performance
- Enable
auto analyzein your cluster settings - Schedule manual
ANALYZEafter bulk loads
Monitoring Cluster Health and Resource Utilization
Tracking Disk Space Usage with STV_PARTITIONS
Query STV_PARTITIONS to spot nodes running low on disk space before they cause failures.
Detecting CPU and Memory Pressure Through STV_EXEC_STATE
STV_EXEC_STATE shows active query steps consuming heavy resources across nodes.
Setting Up Proactive Alerts Using System Table Queries
Schedule these queries via Lambda to catch bottlenecks early.

Getting the most out of Amazon Redshift doesn’t have to feel like rocket science. By tapping into system tables and system views, you get a clear window into what’s actually happening inside your cluster — from slow-running queries and skewed data distribution to memory bottlenecks and table bloat. Each area covered here, whether it’s fine-tuning your WLM queues, rethinking your distribution keys, or staying on top of Vacuum and Analyze, plays a real role in keeping your Redshift environment running fast and smooth.
The best part? You don’t need to overhaul everything at once. Start by regularly checking your system tables to spot the biggest pain points, then tackle them one by one. Small, consistent improvements in table design, workload management, and cluster monitoring can add up to a seriously faster and more reliable data warehouse. So dig into those system views, let the data guide your decisions, and watch your query performance improve over time.