Modern cloud and container environments have become incredibly complex, making it nearly impossible for DevOps teams, site reliability engineers, and platform architects to track what’s running where. Traditional monitoring tools just don’t cut it when you’re dealing with dynamic Kubernetes clusters, microservices spread across multiple clouds, and infrastructure that changes by the minute.
This post is for engineering teams who need better visibility into their cloud native infrastructure and want to move beyond basic monitoring dashboards. If you’re struggling to understand dependencies between services, troubleshoot issues across distributed systems, or make informed decisions about resource allocation, intelligent infrastructure maps can transform how you work.
We’ll dive into why traditional monitoring falls short in complex environments and explore how infrastructure visualization and mapping tools create a clear picture of your entire system. You’ll also learn practical implementation strategies for building infrastructure intelligence that actually helps your team ship faster and sleep better at night.
Understanding the Challenge of Modern Infrastructure Complexity

Exponential Growth of Kubernetes Clusters and Cloud Services
Modern organizations face an infrastructure explosion as Kubernetes deployments multiply across development, staging, and production environments. Cloud services proliferate rapidly, with teams spinning up microservices, databases, message queues, and storage solutions at unprecedented speed. Each new deployment creates additional complexity layers, transforming simple application architectures into sprawling distributed systems. Container orchestration platforms enable rapid scaling, but this agility comes with the hidden cost of managing hundreds or thousands of interconnected components across multiple cloud regions and availability zones.
Hidden Dependencies and Interconnections Causing Operational Blindness
Infrastructure dependencies create invisible webs that traditional monitoring tools struggle to map effectively. A single microservice might depend on multiple databases, external APIs, shared storage volumes, and networking components that span different cloud providers. These interconnections remain opaque until failures cascade through systems, revealing critical paths that teams never documented or understood. Service meshes, load balancers, and container networking add complexity layers that obscure how data flows through applications. When outages occur, teams scramble to understand which services connect to what, wasting precious time during incident response.
Manual Monitoring Limitations and Reactive Troubleshooting Costs
Traditional monitoring approaches rely on static dashboards and manual correlation across multiple tools, creating significant operational overhead. Teams toggle between cloud consoles, Kubernetes dashboards, APM tools, and logging platforms to piece together infrastructure state during incidents. This fragmented approach delays root cause identification and extends mean time to recovery. Alert fatigue becomes common as teams struggle to distinguish critical issues from noise across complex distributed environments. Manual infrastructure mapping efforts quickly become outdated as deployments change, leaving teams with inaccurate documentation during crisis situations.
Impact on Team Productivity and System Reliability
Infrastructure complexity directly undermines developer velocity and operational efficiency across engineering organizations. Teams spend increasing amounts of time on infrastructure troubleshooting rather than feature development, slowing product innovation. New team members require weeks to understand complex deployment topologies, extending onboarding timelines. System reliability suffers as teams make changes without understanding downstream impacts, leading to unexpected failures. The cognitive load of managing complex infrastructure architectures burns out experienced engineers and makes it difficult to maintain institutional knowledge as team composition changes over time.
The Power of Infrastructure Visualization and Mapping

Real-time visibility into distributed system architecture
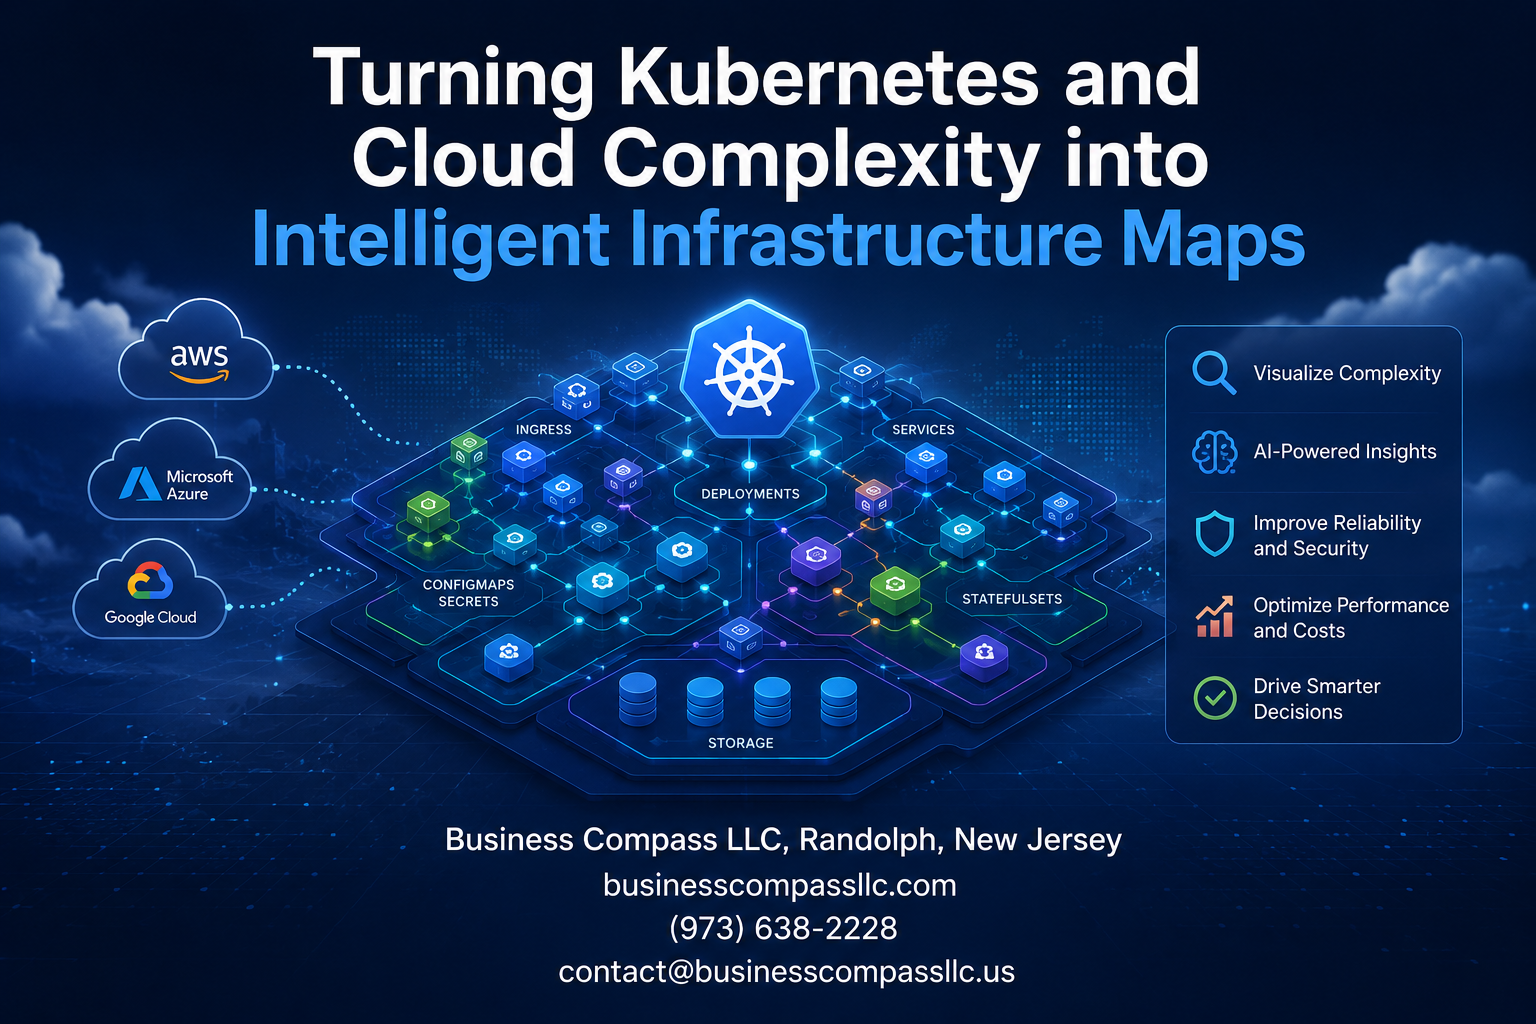
Modern Kubernetes infrastructure mapping transforms how teams understand their complex environments by providing instant visual insights into cluster topology, pod relationships, and cross-service communications. Advanced infrastructure observability platforms automatically generate dynamic topology maps that update in real-time, revealing the true state of containerized workloads across multiple clusters and cloud regions. Teams can instantly spot configuration drift, identify orphaned resources, and understand service mesh connectivity patterns without manually piecing together documentation or running complex queries. This real-time visibility becomes critical during incident response, enabling engineers to quickly trace request flows and pinpoint bottlenecks across the entire distributed architecture.
Automated discovery of service dependencies and data flows
Cloud infrastructure visualization tools excel at automatically mapping intricate service dependencies that would take weeks to document manually. These intelligent systems continuously scan network traffic, API calls, and database connections to build comprehensive dependency graphs showing how microservices interact with external APIs, storage systems, and third-party integrations. The automation captures both direct dependencies and transitive relationships, revealing hidden connections that could cause cascading failures during outages. Smart algorithms analyze communication patterns over time, identifying critical paths and highlighting services that act as single points of failure. This automated discovery process ensures dependency maps stay current as teams deploy new features and modify existing services.
Visual representation of resource utilization and performance metrics
Container orchestration visualization overlays performance data directly onto infrastructure maps, creating heat maps that instantly reveal resource hotspots and capacity constraints. These visual representations combine CPU, memory, and network metrics with topology information, making it easy to spot underutilized nodes and overloaded services at a glance. Teams can drill down from cluster-level views to individual container metrics while maintaining context about how performance issues affect upstream and downstream services. The visualization integrates cost data alongside performance metrics, enabling FinOps teams to identify optimization opportunities where high-cost resources deliver minimal business value. Interactive dashboards allow filtering by namespace, application, or team ownership, making it simple to track resource efficiency across different organizational boundaries.
Key Components of Intelligent Infrastructure Maps

Dynamic Service Mesh Visualization and Traffic Patterns
Kubernetes infrastructure mapping transforms complex service interactions into visual networks that reveal traffic bottlenecks, latency patterns, and communication dependencies between microservices. Modern visualization platforms capture real-time data flows, protocol-level metrics, and request patterns across your entire service mesh topology. Teams gain immediate insights into which services generate the most traffic, where failures occur, and how changes ripple through interconnected components. Advanced platforms overlay performance metrics directly onto topology diagrams, making it simple to spot services consuming excessive resources or experiencing degraded response times. This visibility becomes crucial when troubleshooting distributed applications where a single failing service can cascade failures across dozens of dependent components.
Multi-Cloud Resource Topology and Cost Attribution
Cloud infrastructure visualization maps resources across AWS, Azure, Google Cloud, and hybrid environments while tracking associated costs and dependencies. Intelligent infrastructure maps connect virtual machines, storage systems, databases, and networking components into comprehensive topology views that span multiple cloud providers. Cost attribution features automatically tag expenses to specific teams, projects, or applications based on resource relationships and usage patterns. Organizations discover hidden dependencies between cloud regions, identify orphaned resources consuming unnecessary budget, and optimize placement strategies for better performance and cost efficiency. Real-time cost tracking enables teams to see exactly how infrastructure changes impact spending across different cloud platforms and services.
Security Posture Mapping and Vulnerability Identification
Security visualization layers threat intelligence and vulnerability data directly onto infrastructure topology maps, creating comprehensive security posture dashboards. Kubernetes monitoring tools highlight exposed services, misconfigured network policies, and containers running with elevated privileges across your entire cluster landscape. Vulnerability scanning integrates with infrastructure observability platforms to show which specific workloads contain outdated packages, known CVEs, or insecure configurations. Teams can trace attack vectors through interconnected services, identify blast radius scenarios, and prioritize remediation based on actual infrastructure relationships. Automated compliance checking flags resources that violate security policies while providing clear paths to resolution through visual workflow mapping.
Capacity Planning Insights Through Predictive Analytics
Predictive analytics transforms historical resource utilization data into actionable capacity planning recommendations that prevent performance bottlenecks before they occur. Container orchestration visualization tracks CPU, memory, storage, and network usage patterns to forecast when clusters will exceed capacity thresholds. Machine learning algorithms analyze seasonal traffic patterns, application scaling behaviors, and resource consumption trends to suggest optimal cluster sizing and node configurations. Teams receive early warnings about approaching resource constraints, automated recommendations for vertical and horizontal scaling decisions, and cost projections for different capacity planning scenarios. This proactive approach eliminates reactive firefighting and ensures applications maintain consistent performance during peak demand periods.
Integration with Existing Monitoring and Alerting Systems
Infrastructure intelligence platforms seamlessly connect with popular monitoring tools like Prometheus, Grafana, Datadog, and New Relic to create unified observability experiences. API-driven integrations pull metrics, logs, and traces from existing systems while enriching them with topology context and relationship mapping. Alert correlation engines analyze signals from multiple monitoring sources to reduce noise and identify root causes faster through infrastructure relationship analysis. Teams maintain their existing monitoring investments while gaining enhanced context about how alerts relate to broader infrastructure health and dependencies. Webhook integrations enable bidirectional data flow, allowing infrastructure maps to trigger alerts in existing systems and receive enriched context from external monitoring platforms.
Implementation Strategies for Infrastructure Intelligence

Selecting the right mapping tools for your environment
Choosing effective Kubernetes infrastructure mapping tools requires matching your specific environment needs with platform capabilities. Enterprise-grade solutions like Datadog, New Relic, and Prometheus offer comprehensive Kubernetes monitoring tools with advanced topology mapping features. Open-source alternatives such as Grafana, Jaeger, and Kiali provide cost-effective cloud infrastructure visualization for smaller teams. Evaluate tools based on your cluster size, multi-cloud requirements, and integration capabilities with existing observability platforms.
Establishing automated data collection pipelines
Building robust data collection pipelines forms the backbone of intelligent infrastructure maps. Deploy monitoring agents across all cluster nodes to capture real-time metrics, logs, and traces automatically. Configure service mesh integration to track microservice communication patterns and dependencies. Set up automated discovery mechanisms that detect new resources and update your infrastructure topology mapping without manual intervention. Implement data retention policies and establish secure API connections between your Kubernetes clusters and visualization platforms.
Creating actionable dashboards for different stakeholder roles
Design role-specific dashboards that deliver relevant insights to each team member. Operations teams need detailed cluster health metrics, resource utilization trends, and alert summaries for proactive infrastructure complexity management. Development teams benefit from application performance dashboards showing service dependencies, error rates, and deployment status. Executives require high-level infrastructure intelligence views featuring cost optimization opportunities, compliance status, and business impact metrics. Create customizable widgets that allow users to drill down from overview screens into specific container orchestration visualization details.
Measuring Success and Continuous Optimization

Reduced Mean Time to Resolution for Incidents
Intelligent infrastructure maps dramatically cut incident response times by providing real-time visibility into your Kubernetes clusters and cloud resources. When outages occur, teams can quickly trace dependencies, identify root causes, and understand blast radius without manually hunting through logs. Visual topology mapping shows exactly which services, pods, and nodes are affected, enabling faster troubleshooting and restoration of critical systems.
Improved Resource Efficiency and Cost Optimization
Infrastructure visualization reveals hidden inefficiencies in your cloud native environment, exposing over-provisioned resources, idle workloads, and bottlenecks. Teams can spot underutilized nodes, right-size containers, and optimize resource allocation based on actual usage patterns. Smart mapping tools automatically identify cost-saving opportunities across your Kubernetes infrastructure, helping organizations reduce cloud spending by 20-30% while maintaining performance standards.
Enhanced Security Compliance and Risk Management
Comprehensive infrastructure observability platforms strengthen security posture by mapping network flows, service communications, and access patterns across your container orchestration environment. Security teams gain clear visibility into potential attack vectors, unauthorized connections, and compliance violations. Automated risk assessment features highlight vulnerable configurations, outdated images, and misaligned security policies, enabling proactive threat mitigation and regulatory compliance maintenance.
Accelerated Development Cycles Through Better Infrastructure Understanding
Development teams move faster when they understand the complete infrastructure landscape supporting their applications. Interactive topology maps help developers visualize service dependencies, API connections, and data flows, reducing deployment risks and debugging time. Clear infrastructure intelligence eliminates guesswork around resource requirements, scaling patterns, and integration points, allowing teams to ship features more confidently and frequently without breaking existing systems.

Managing modern Kubernetes and cloud environments doesn’t have to feel like solving a puzzle with missing pieces. Smart infrastructure maps give you the clarity you need to see how everything connects, spot problems before they blow up, and make decisions based on real data instead of guesswork. When you can visualize your entire setup in one place, troubleshooting becomes faster, costs become more predictable, and your team stops wasting time hunting down mysterious issues.
The shift from complex, scattered infrastructure to intelligent mapping isn’t just a nice-to-have upgrade—it’s becoming essential for teams that want to stay competitive. Start small by mapping your most critical services, focus on the metrics that actually matter to your business, and build from there. Your future self will thank you when that 3 AM alert turns into a quick fix instead of an all-night debugging session.