

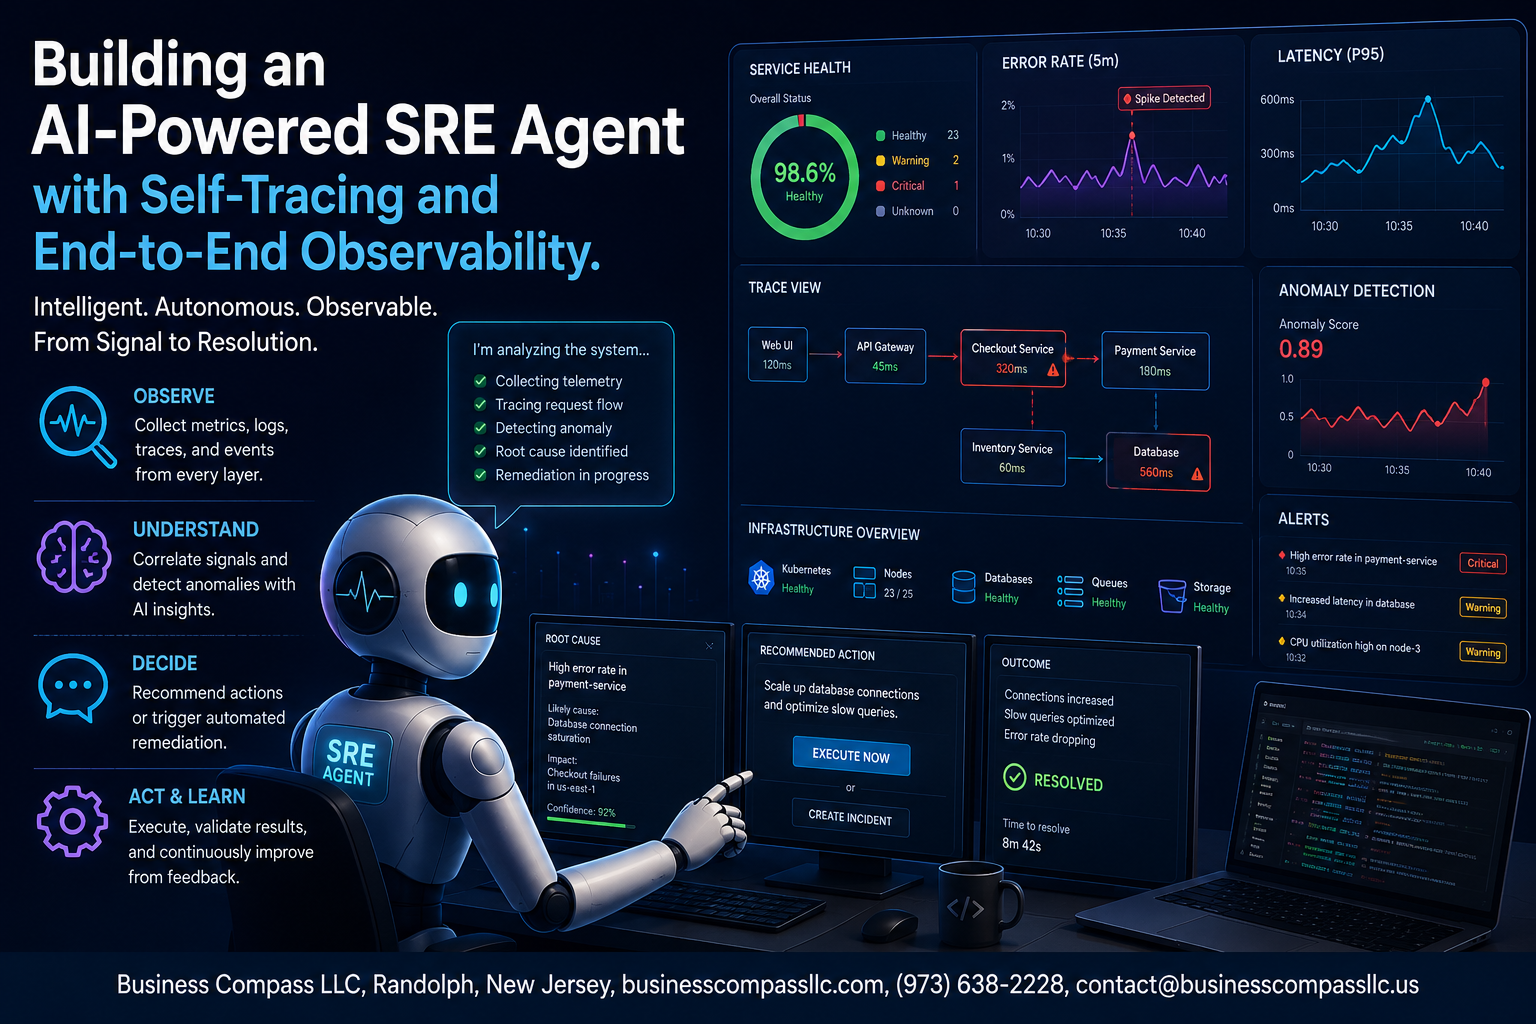
Building an AI-Powered SRE Agent with Self-Tracing and End-to-End Observability
On-call alerts at 3 AM, cascading failures across microservices, and an overwhelmed team scrambling through dashboards — this is the reality for most engineering teams running complex production systems today. AI-powered SRE agents are changing that equation fast, and if you’re an SRE, platform engineer, or DevOps practitioner trying to make sense of how to actually build one that works, you’re in the right place.
This guide is written for engineers who are already comfortable with observability concepts and want to go beyond basic monitoring setups. We’re talking about building something that can reason, respond, and trace its own actions — not just a fancier alerting tool.
Here’s what we’ll walk through together:
- How AI fits into modern site reliability engineering — specifically where LLM-based agents add real value in an intelligent SRE automation workflow and where they can fall short
- How to implement self-tracing so your AI agent doesn’t become a black box that you can’t debug when something goes wrong in production environment monitoring
- How to wire up end-to-end observability tools across your entire stack so you get full visibility into both your infrastructure and the AI agent itself, from the LLM observability platform layer all the way down
By the end, you’ll have a clear blueprint for building, deploying, and measuring an AI-driven incident response system that your team can actually trust.
Understanding the Role of AI in Modern Site Reliability Engineering

Why Traditional SRE Practices Struggle to Scale
Modern infrastructure has grown wildly complex — microservices, multi-cloud deployments, Kubernetes clusters, and hundreds of interdependent services all running simultaneously. Traditional SRE practices were built for a different era, where teams could reasonably monitor a handful of systems manually. Today, that’s simply not realistic.
- Alert fatigue is real: Teams drowning in thousands of alerts per day can’t effectively triage what actually matters
- On-call burnout: Human engineers can’t sustain 24/7 vigilance across sprawling distributed systems without serious cognitive cost
- Reactive, not proactive: Manual runbooks and static dashboards catch problems after customers already feel the pain
- Slow mean time to resolution (MTTR): Correlating signals across logs, metrics, and traces manually takes time that production environments simply can’t afford
How AI Agents Transform Incident Detection and Response
An AI-powered SRE agent changes the game entirely by operating continuously, learning from historical incident patterns, and taking action faster than any human team could. Instead of waiting for an engineer to notice a spike in error rates, the agent detects anomalies, correlates signals across the full observability stack, hypothesizes root causes, and can trigger automated remediation — all within seconds.
- Continuous pattern recognition across metrics, logs, and distributed traces
- Automated hypothesis generation grounded in historical runbook knowledge
- AI-driven incident response that escalates intelligently rather than blindly paging on-call engineers
- Self-healing actions like pod restarts, traffic rerouting, or scaling adjustments executed without human intervention
Key Capabilities That Make AI-Powered SRE Agents Effective
Not every AI agent is built for production-grade reliability work. The ones that actually deliver results share a specific set of capabilities that separate them from simple rule-based automation tools.
- LLM observability platform integration: The agent needs full visibility into its own reasoning — what it detected, why it acted, and what it decided not to do
- Self-tracing AI observability: Every decision the agent makes gets traced end-to-end, so engineers can audit, debug, and improve agent behavior over time
- End-to-end observability tools: Seamless integration across your entire stack — APM, log aggregation, infrastructure metrics, and real user monitoring
- Contextual awareness: Understanding service dependencies and blast radius before taking any automated action
- Intelligent SRE automation: Knowing when to act autonomously versus when to loop in a human, based on confidence thresholds and risk assessment
Core Components of an AI-Powered SRE Agent
Designing the Agent Architecture for Reliability Workflows
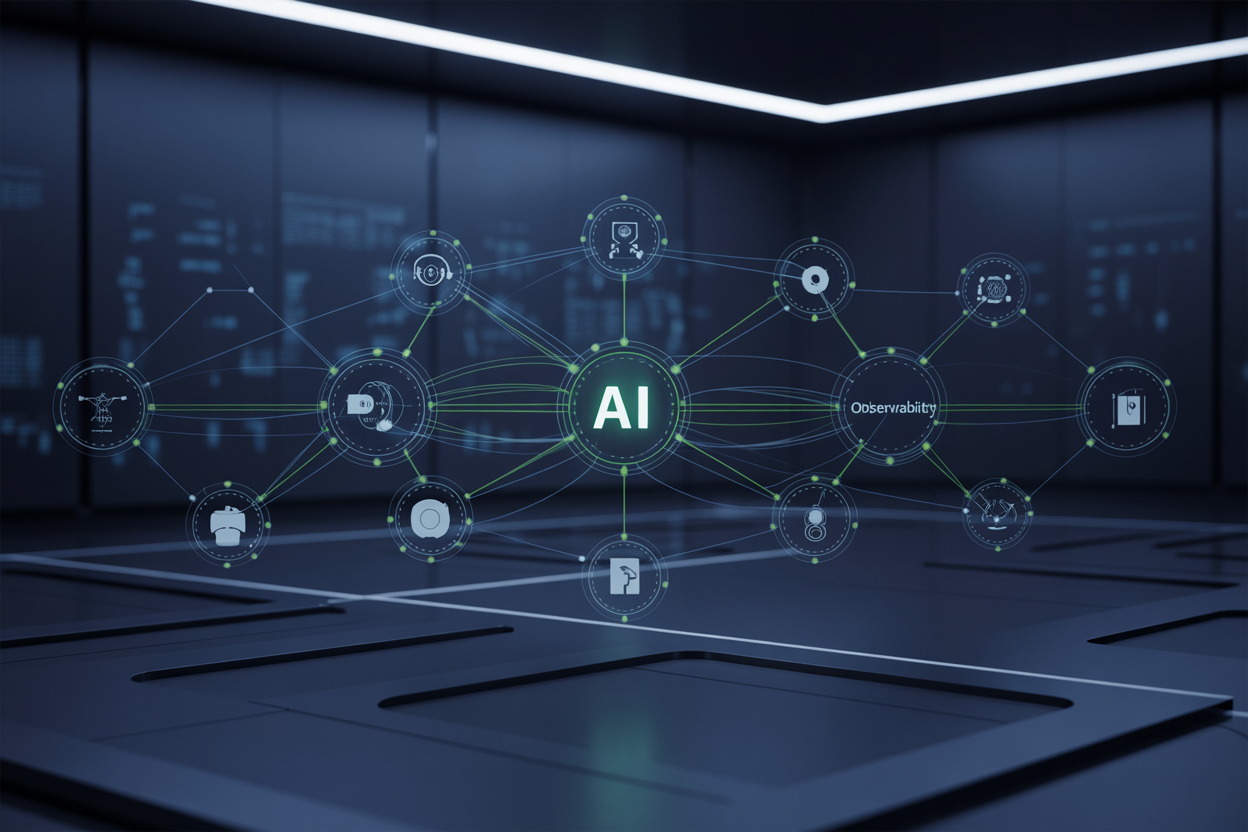
A solid AI-powered SRE agent starts with a modular, event-driven architecture where each component has a clear job. Think of it like a well-organized kitchen — the ingestion layer pulls in alerts, logs, and metrics; the reasoning layer decides what matters; and the action layer actually does something about it.
Key architectural building blocks include:
- Event ingestion pipeline — collects signals from monitoring tools, log aggregators, and alerting systems in real time
- Context enrichment layer — tags incoming events with service ownership, deployment history, and dependency maps
- Decision engine — routes events to the right workflow based on severity, affected service, and historical patterns
- Action executor — triggers runbooks, restarts services, or pages on-call engineers
Integrating Large Language Models for Root Cause Analysis
LLMs bring something traditional rule-based systems can’t — the ability to read through messy, unstructured log data and actually make sense of it. When an incident fires, the agent feeds relevant logs, metrics, and recent deployment changes into the LLM, which then generates a plain-language root cause hypothesis.
What makes this work well in practice:
- Prompt engineering with context windows — structured prompts that include service topology, recent changes, and error patterns give the LLM enough context to reason accurately
- RAG (Retrieval-Augmented Generation) — the agent pulls relevant past incident reports and runbook documentation before sending anything to the LLM, grounding its analysis in your team’s actual history
- Confidence scoring — attaching a confidence level to each hypothesis helps the agent decide whether to act automatically or hand off to a human
Pairing LLM observability platform tools with your LLM calls is non-negotiable here. You need to see what prompts went in, what came out, and how long it took — especially when you’re debugging why the agent made a wrong call at 3am.
Building Automated Remediation and Escalation Logic
Not every incident needs a human. A well-designed AI-driven incident response system knows the difference between “restart this pod” and “wake someone up immediately.”
A practical escalation framework looks like this:
- Tier 1 — Auto-remediation: The agent handles known, low-risk issues automatically — clearing disk space, restarting crashed services, scaling up pods under load
- Tier 2 — Assisted remediation: The agent drafts a fix and waits for one-click approval from an on-call engineer before executing
- Tier 3 — Human escalation: For anything ambiguous or high-blast-radius, the agent pages the right team with a full incident summary already written
Safety guardrails matter a lot here. Build in dry-run modes, blast radius checks, and rollback mechanisms before any automated action touches production.
Connecting the Agent to Live Infrastructure and Monitoring Tools
The agent is only as good as the data it can see. Connecting it to your observability stack means integrating across multiple layers:
- Metrics platforms (Prometheus, Datadog, CloudWatch) — for real-time performance signals
- Log aggregators (Elasticsearch, Loki, Splunk) — for detailed diagnostic data
- Tracing systems (Jaeger, Tempo, Honeycomb) — for distributed request visibility across microservices
- Alerting tools (PagerDuty, OpsGenie) — to receive and acknowledge incidents
- Infrastructure APIs (Kubernetes API, AWS SDK, Terraform) — to actually take action
Use standardized interfaces like OpenTelemetry wherever possible. It keeps your production environment monitoring setup portable and avoids tight coupling to any single vendor. When the agent calls an external tool, that call itself should be instrumented — so you always know what the agent did, when, and why.
Implementing Self-Tracing for Complete Agent Transparency

What Self-Tracing Means in the Context of AI Agents
Self-tracing in an AI-powered SRE agent means the agent records its own thought process — every tool call, every decision branch, every LLM prompt and response — as it works through an incident. Think of it like a flight data recorder, but for your automation. Instead of wondering why the agent restarted a pod or escalated an alert, you get a full, timestamped playbook of exactly what happened and why.
Capturing Every Decision Step the Agent Takes
Every action your SRE agent takes should leave a trace behind. That means capturing:
- Input context — what metrics, logs, or alerts triggered the agent
- LLM prompts and completions — the exact reasoning chain the model produced
- Tool invocations — which APIs, runbooks, or scripts were called and with what parameters
- Branching logic — where the agent considered multiple paths and which one it chose
- Timestamps and latency — how long each step took
Wrapping your agent’s tool calls and LLM interactions with an LLM observability platform like OpenTelemetry-compatible tracing gives you structured spans you can actually search through during a post-mortem.
Storing and Querying Agent Traces for Faster Debugging
Raw traces are useless if you can’t find them fast. Store agent traces in a backend built for search — Elasticsearch, ClickHouse, or a purpose-built AI agent monitoring store. Tag every trace with:
- Incident ID
- Agent version
- Root cause category
- Resolution outcome
This lets on-call engineers pull up the exact trace from last Tuesday’s outage in seconds, not minutes, which cuts your mean time to understand (MTTU) dramatically.
Using Trace Data to Continuously Improve Agent Behavior
Trace data isn’t just for debugging — it’s training fuel. By reviewing traces where the agent made wrong calls or took unnecessary steps, you can:
- Fine-tune prompts to handle edge cases better
- Add guardrails around risky tool calls
- Identify knowledge gaps in your runbook coverage
- Build regression test suites from real production traces
This feedback loop is what separates a static automation script from a genuinely intelligent SRE automation system that gets sharper over time.
Avoiding Common Pitfalls in AI Agent Traceability
A few things consistently trip teams up when setting up self-tracing AI observability:
- Over-logging everything without structure makes traces noisy and expensive to store — be selective about what goes into a span versus a log line
- Not correlating agent traces with infrastructure traces breaks the end-to-end picture — always propagate trace context from your agent into downstream service calls
- Ignoring token-level LLM metadata like prompt token counts and model temperature means you lose critical debugging context for hallucination-related failures
- Forgetting to version your traces makes it impossible to compare agent behavior across deployments
Getting these basics right from day one saves a lot of pain when your AI-driven incident response system starts handling hundreds of incidents per day in a live production environment.
Achieving End-to-End Observability Across the Entire Stack

Unifying Metrics, Logs, and Traces Into a Single View
Pulling metrics, logs, and traces into one unified view is the backbone of any solid end-to-end observability setup. Without this, you’re constantly switching between tools, losing context, and missing the full picture when something breaks.
- Use OpenTelemetry as a vendor-neutral standard to collect signals across every layer of your stack
- Route everything — agent decisions, API calls, infrastructure metrics — into a single backend like Grafana, Datadog, or Honeycomb
- Correlate trace IDs across your AI-powered SRE agent and downstream services so you can follow a single incident from detection to resolution without jumping between dashboards
Instrumenting the AI Agent Alongside Application Services
Your AI agent monitoring setup should treat the agent exactly like any other service in your stack — not as a black box sitting outside your observability pipeline.
- Wrap every LLM call with spans that capture prompt tokens, response latency, model version, and tool invocations
- Attach the same trace context used by application services so the agent’s reasoning chain stays linked to the actual system events it’s responding to
- Tag spans with intent labels like
incident_triageorrunbook_lookupso your LLM observability platform can filter agent behavior by task type
Visualizing Agent Actions in Real-Time Dashboards
Real-time dashboards turn raw telemetry into something your team can actually act on during a live incident.
- Build panels that show active agent tasks, current reasoning steps, and tool call success rates side by side with service health metrics
- Use heatmaps to spot patterns — like which alert types consistently trigger longer agent response chains
- Surface AI-driven incident response timelines so on-call engineers can see exactly what the agent did, when it did it, and why
Deploying and Testing the SRE Agent in Production Environments
Validating Agent Reliability Through Chaos Engineering
Running your AI-powered SRE agent in production without stress-testing it first is like shipping code without unit tests — you’re just hoping for the best. Chaos engineering lets you deliberately break things in a controlled way so you can see exactly how the agent responds before a real incident hits.
Key chaos experiments to run against your SRE agent:
- Latency injection — Slow down downstream services and check whether the agent correctly identifies degraded performance versus full outages
- Dependency failures — Kill individual microservices and validate that the agent’s incident response follows the right runbook, not a generic fallback
- Data poisoning scenarios — Feed the agent noisy or contradictory telemetry to see if it hallucinates a root cause or flags uncertainty appropriately
- Concurrent incident storms — Trigger multiple simultaneous alerts to test whether the agent prioritizes correctly without getting overwhelmed
Tools like Gremlin, Chaos Monkey, or LitmusChaos pair well here. Combine them with your LLM observability platform so every agent decision made during chaos runs gets traced, scored, and reviewed.
Establishing Safe Guardrails to Prevent Unintended Actions
An AI-driven incident response agent that can restart services, roll back deployments, or page on-call engineers needs hard boundaries — full stop. Without guardrails, one misconfigured prompt or unexpected edge case can turn an automated fix into an outage amplifier.
Practical guardrails to put in place:
- Action whitelists — Define explicitly which actions the agent can take autonomously (e.g., scaling pods) versus which ones require a human approval step (e.g., database restarts)
- Blast radius limits — Cap the number of automated actions the agent can chain together in a single incident window without a checkpoint
- Confidence thresholds — If the agent’s reasoning score drops below a set threshold, it should escalate rather than act
- Dry-run mode by default — New capabilities should always ship in observe-only mode first, logging what the agent would have done before granting real execution rights
- Immutable audit logs — Every action, skipped action, and escalation gets written to a tamper-proof log tied to the self-tracing AI observability layer
Think of guardrails less as restrictions and more as the thing that actually earns organizational trust in automation over time.
Strategies for Gradual Rollout and Human-in-the-Loop Oversight
The fastest way to kill adoption of intelligent SRE automation is to push it too hard, too fast. A phased rollout keeps your team confident while the agent builds a track record it can actually be evaluated on.
A solid rollout progression looks like this:
- Shadow mode — The agent observes real incidents and logs its recommendations without acting. Your team reviews outputs and calibrates prompts.
- Notify-only mode — The agent sends Slack or PagerDuty messages with suggested actions, but a human clicks the button. This builds trust and surfaces edge cases fast.
- Supervised autonomy — The agent acts on a narrow, pre-approved action set autonomously, with a human reviewer checking the AI agent monitoring dashboard post-incident.
- Expanded autonomy — Based on measured accuracy and incident outcome data, the action set grows incrementally with ongoing human spot-checks.
Human-in-the-loop isn’t just a safety net — it’s also your feedback pipeline. Every time an engineer overrides the agent or approves its suggestion, that signal feeds back into evaluation datasets, helping you tune the model and prompts over time. Pair this with end-to-end observability tools that surface agent behavior across the full observability stack implementation so reviewers aren’t flying blind when they audit decisions.
Measuring the Business Impact of Your AI-Powered SRE Agent
Key Metrics to Track Agent Performance Over Time
Tracking the right numbers makes all the difference when proving your AI-powered SRE agent delivers real value. Focus on these core metrics:
- Alert noise reduction rate – percentage of false positives filtered out
- Autonomous resolution rate – incidents handled without human intervention
- Detection-to-triage time – how fast the agent pinpoints root cause
- Agent decision accuracy – correct diagnoses vs. total investigations
Quantifying Reductions in Mean Time to Resolution
MTTR is the clearest signal that your AI-driven incident response system is working. Compare pre-agent and post-agent baselines across incident severity levels. Teams typically see 40–70% MTTR reductions once the agent starts correlating signals from across the observability stack automatically, cutting the manual investigation grind entirely.
Demonstrating ROI to Engineering and Leadership Teams
Leadership wants dollars, not dashboards. Translate your metrics into financial terms:
- Engineering hours saved per incident × average hourly cost
- Downtime cost avoided using revenue-per-minute calculations
- On-call burnout reduction, which directly impacts retention spending
Pair these numbers with data from your LLM observability platform to show exactly where the agent created value.
Iterating on Agent Capabilities Based on Real-World Feedback
Real production feedback beats any synthetic benchmark. Build a feedback loop where on-call engineers rate agent recommendations after each incident. Use that data alongside self-tracing AI observability logs to spot where reasoning breaks down, then retrain or refine prompts accordingly. Small, consistent iterations compound into dramatically smarter intelligent SRE automation over time.

AI-powered SRE agents are changing how teams handle reliability — from detecting issues faster to automating responses that used to eat up hours of manual work. When you combine self-tracing with end-to-end observability, you’re not just building a smarter agent, you’re building one you can actually trust. Every decision it makes becomes visible, traceable, and improvable over time.
If you’re ready to take the next step, start small — deploy in a controlled environment, measure the impact against your existing baselines, and let the data guide your confidence. The teams getting the most out of AI-powered SRE aren’t the ones who went all-in overnight. They’re the ones who built thoughtfully, observed carefully, and kept refining. That’s the approach worth taking.