


Stop Guessing When Your EC2 Instances Need More RAM
AWS EC2 auto scaling works great out of the box — until you need it to react to memory pressure. CPU scaling is built in, but AWS EC2 scaling based on RAM usage requires a few extra steps that most tutorials skip over or explain poorly.
This guide is for DevOps engineers, cloud architects, and developers who are running workloads where memory, not CPU, is the bottleneck. Think Java applications, in-memory caching, data processing jobs — anything that eats RAM fast under load.
Here’s what you’ll walk away knowing:
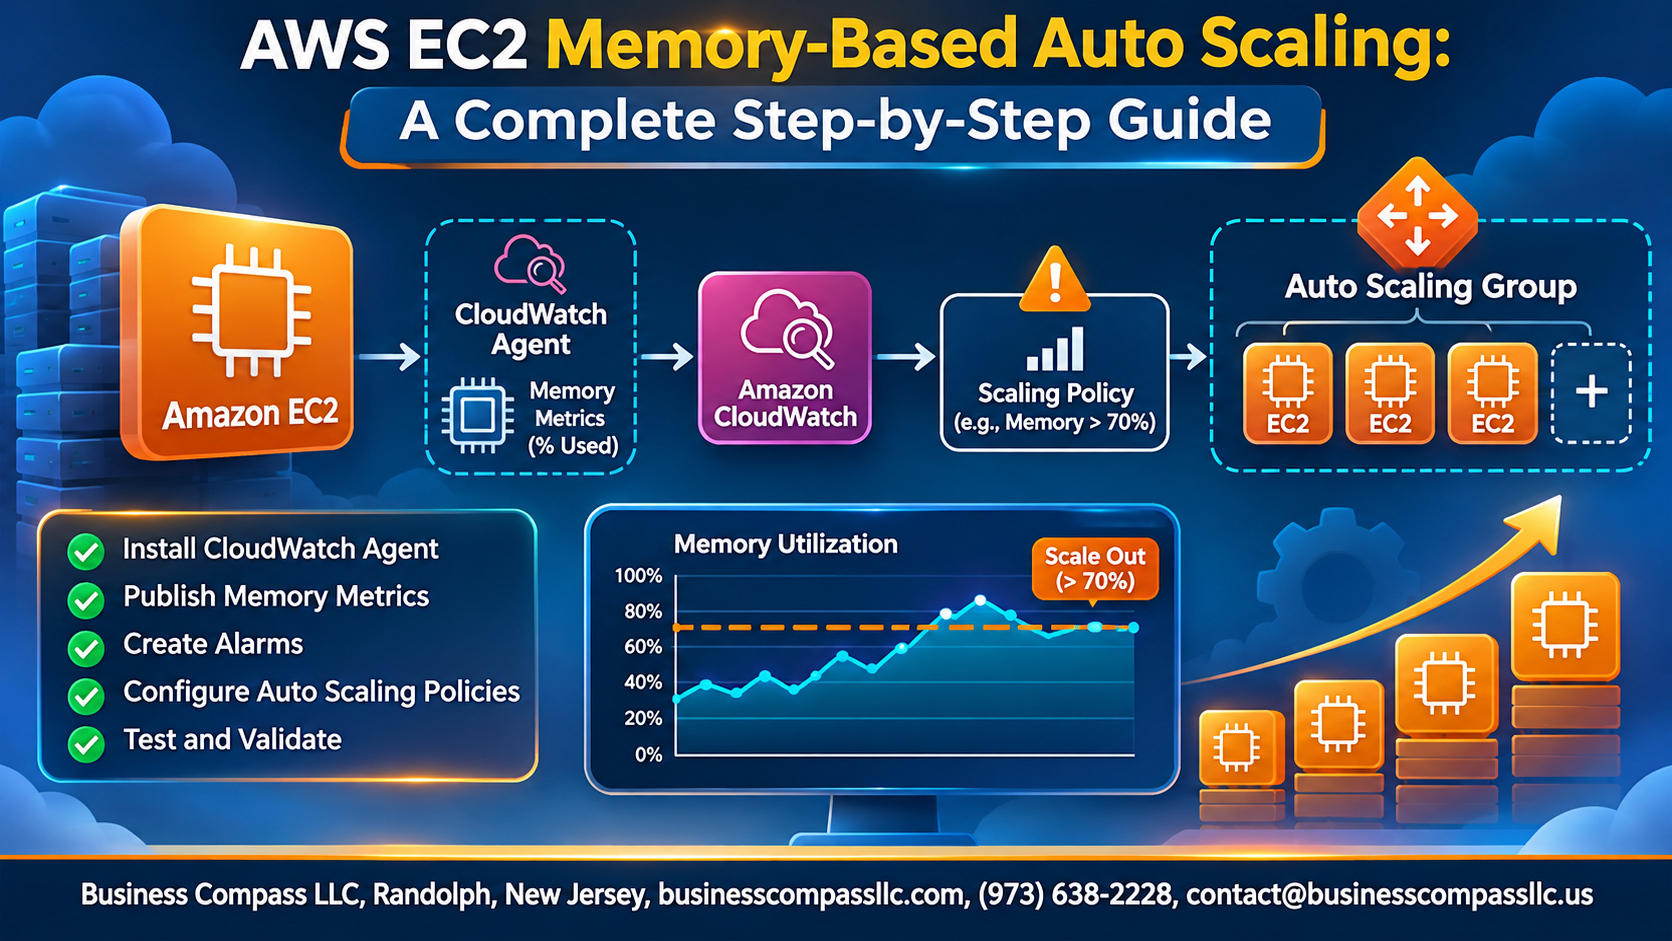
- How to install and configure the CloudWatch agent to push custom memory metrics from your EC2 instances to CloudWatch
- How to build EC2 custom memory alarms in CloudWatch that fire when your instances hit a memory threshold you actually care about
- How to wire those alarms directly into auto scaling policies so your fleet scales up or down automatically based on real memory utilization data
No fluff, no hand-waving. Just the actual steps, in order, with the context you need to make each one stick. By the end, you’ll have a fully working memory-based auto scaling setup on AWS that you can test, validate, and tune for your specific workload.
Let’s get into it.
Understanding Memory-Based Auto Scaling on AWS EC2

Why CPU Metrics Alone Are Not Enough for Scaling Decisions
CPU spikes don’t always reflect real application stress — memory pressure often does.
How Memory Metrics Drive Smarter Scaling Policies
AWS EC2 auto scaling memory metrics let you trigger scaling actions based on actual RAM usage, catching bottlenecks CPU misses.
Key Benefits of Memory-Based Auto Scaling
- Prevents out-of-memory crashes
- Reduces over-provisioning costs
- Improves application stability
Essential Prerequisites Before You Begin

A. Required AWS IAM Permissions and Roles
- Attach CloudWatchAgentServerPolicy to your EC2 instance role
- Ensure ec2:DescribeInstances and autoscaling:PutScalingPolicy permissions exist
B. EC2 Instance Types Best Suited for Memory Monitoring
- Memory-optimized: R6i, X2idn
C. Tools and Dependencies
- CloudWatch Agent, AWS CLI v2, SSM Agent
Setting Up the CloudWatch Agent to Collect Memory Metrics

A. Downloading and Installing the CloudWatch Agent on EC2
Run this command to grab the agent:
sudo yum install amazon-cloudwatch-agent
B. Configuring the Agent to Capture Memory Utilization Data
Use the wizard: sudo /opt/aws/amazon-cloudwatch-agent/bin/amazon-cloudwatch-agent-config-wizard, selecting mem_used_percent.
C. Verifying That Memory Metrics Appear in CloudWatch
Check CloudWatch > Metrics > CWAgent for mem_used_percent.
D. Troubleshooting Common Agent Configuration Errors
Restart with: sudo systemctl restart amazon-cloudwatch-agent
Creating Custom CloudWatch Alarms for Memory Thresholds

A. Choosing the Right Memory Utilization Thresholds
- Scale out at 75–80% memory for most web apps
- Scale in at 40–50% to cut costs safely
B. Scale-Out Alarms for Traffic Spikes
Set EC2 custom memory alarms in CloudWatch triggering when mem_used_percent > 75 for two consecutive periods.
C. Scale-In Alarms for Low Demand
Trigger scale-in when memory drops below 40%.
Configuring Auto Scaling Policies Based on Memory Metrics

A. Setting Up Target Tracking Scaling Policies
Configure target tracking to maintain memory at 60–70% by selecting your custom CloudWatch metric.
B. Defining Step Scaling Policies
Add instances incrementally — one at 70%, two at 85% memory usage.
C. Linking Alarms to Auto Scaling
Attach your EC2 custom memory alarms directly to scaling actions.
D. Cooldown Periods
Set 300-second cooldowns to prevent rapid scaling fluctuations.
Testing and Validating Your Memory-Based Auto Scaling Setup

Simulating Memory Load to Trigger Scale-Out Events
Run stress --vm 2 --vm-bytes 80% on your EC2 instance to spike RAM usage and trigger your CloudWatch custom memory alarm.
Confirming Scale-In Behavior After Load Decreases
Stop the stress tool and watch CloudWatch metrics drop below your threshold, triggering scale-in.
Reviewing Auto Scaling Activity Logs
Check EC2 Console → Auto Scaling Groups → Activity tab for scaling event accuracy.
Optimizing and Monitoring Your Setup Over Time

Using CloudWatch Dashboards to Track Memory Trends
Build dashboards combining AWS EC2 auto scaling memory metrics with CPU and network data for a full picture.
Refining Thresholds Based on Real-World Performance Data
- Adjust memory thresholds after reviewing actual traffic patterns
Reducing Costs by Combining Memory and CPU Scaling Policies
Pair RAM and CPU CloudWatch custom metrics EC2 memory alarms to avoid unnecessary scaling.
Automating Alerts for Scaling Anomalies

Memory-based auto scaling on AWS EC2 gives you a smarter way to manage your infrastructure — one that actually responds to what’s happening inside your instances, not just at the surface level. By setting up the CloudWatch agent, creating custom alarms, and tying everything together with the right scaling policies, you get a setup that grows and shrinks with your real workload demands, saving you both money and headaches.
The key to making this work long-term is not just getting it running but keeping an eye on it. Test it regularly, tweak your thresholds as your app evolves, and don’t treat it as a “set it and forget it” solution. Start with the steps in this guide, get your first scaling policy live, and build from there — your future self (and your cloud bill) will thank you.