Managing Production Kubernetes GitOps environments requires smart scaling strategies that balance performance with cost efficiency. This guide is designed for DevOps engineers, platform teams, and Kubernetes administrators who want to build robust, self-managing clusters that scale automatically based on real workload demands.
You’ll learn how to combine GitOps principles with modern autoscaling tools to create production-ready systems. We’ll start by exploring GitOps configuration management fundamentals and how they create the foundation for reliable scaling operations. Then we’ll dive deep into implementing HPA Horizontal Pod Autoscaler for dynamic workload management, showing you exactly how to configure metrics-driven scaling that responds to traffic patterns in real-time.
Next, we’ll cover Karpenter node autoscaling strategies that optimize your infrastructure costs while maintaining performance. You’ll see how Karpenter works alongside your GitOps CI/CD pipeline to provision the right nodes at the right time, eliminating over-provisioning waste. Finally, we’ll explore Production Kubernetes monitoring techniques and optimization strategies that help you fine-tune your scaling configurations and catch issues before they impact users.
By the end, you’ll have a complete blueprint for Kubernetes cost optimization through intelligent autoscaling, backed by GitOps practices that make your infrastructure changes predictable and reversible.
GitOps Fundamentals for Production Kubernetes

Core GitOps principles and workflow automation
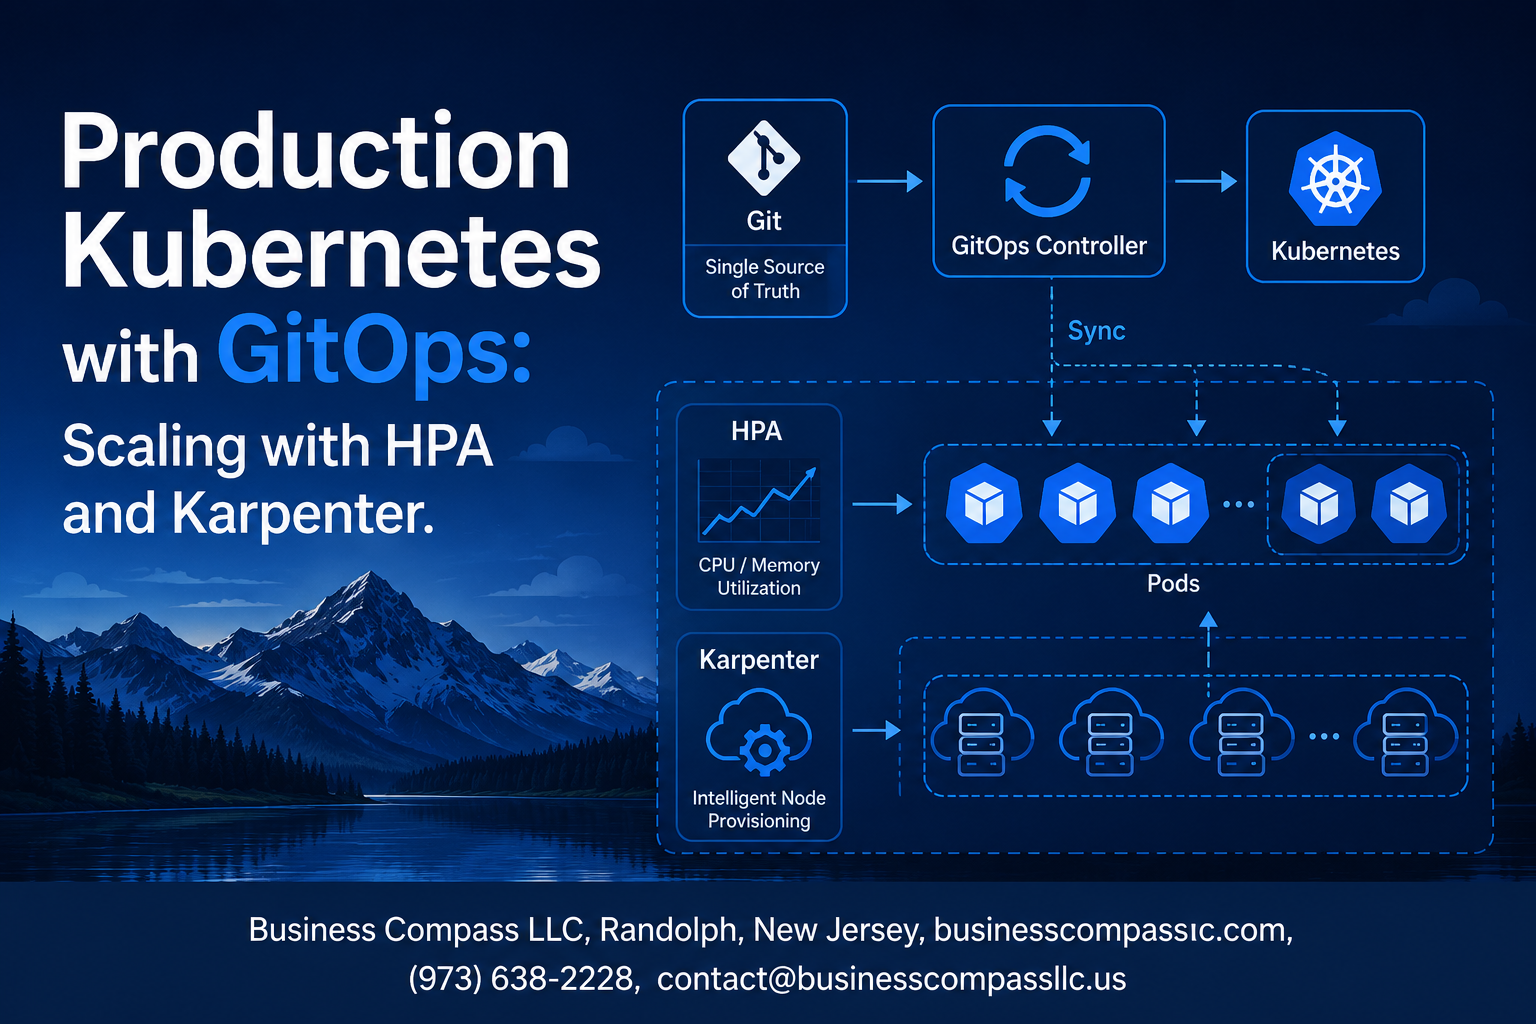
GitOps transforms Production Kubernetes GitOps by treating Git as the single source of truth for infrastructure configuration. The workflow revolves around declarative definitions stored in version-controlled repositories, where changes trigger automated deployments through pull-based mechanisms. Teams commit infrastructure changes to Git, and specialized operators continuously monitor repositories for updates, automatically syncing desired state with actual cluster configuration. This approach eliminates manual kubectl commands and reduces configuration drift, ensuring consistency across environments. Automated rollbacks become seamless when Git history serves as the deployment timeline, while branch-based workflows enable proper testing and approval processes before production changes.
Git repository structure for Kubernetes configurations
Effective GitOps configuration management requires a well-organized repository structure that separates concerns and environments. The typical layout includes dedicated directories for applications, infrastructure components, and environment-specific configurations. A common pattern organizes repositories with separate folders for staging and production, each containing application manifests, Helm charts, and Kustomize overlays. Environment-specific parameters live in distinct branches or directories, preventing accidental cross-environment deployments. Application teams maintain their service definitions in dedicated repositories, while platform teams manage cluster-wide configurations like ingress controllers, monitoring stacks, and autoscaling policies. This separation enables fine-grained access control and independent release cycles.
Continuous deployment pipelines with ArgoCD or Flux
ArgoCD and Flux serve as the backbone of GitOps CI/CD pipeline implementation, continuously monitoring Git repositories and maintaining cluster state synchronization. ArgoCD provides a comprehensive web interface for visualizing application deployments, tracking sync status, and managing rollbacks across multiple clusters. Its application-centric approach groups related resources and provides detailed health checks and sync policies. Flux operates as a lightweight alternative, focusing on automated Git-to-cluster synchronization with strong integration into the Kubernetes ecosystem. Both tools support multi-tenant configurations, enabling teams to manage their applications independently while maintaining centralized oversight. Progressive delivery capabilities allow for canary deployments and automated rollbacks based on health metrics.
Security benefits of declarative infrastructure management
Declarative infrastructure management through GitOps enhances security by eliminating direct cluster access and establishing audit trails for all configuration changes. Git’s immutable history provides comprehensive tracking of who made changes, when modifications occurred, and the complete context surrounding each update. Role-based access controls at the Git level replace complex Kubernetes RBAC configurations, simplifying permission management. Secret management integrates with external systems like HashiCorp Vault or AWS Secrets Manager, preventing sensitive data from appearing in Git repositories. The pull-based deployment model ensures that clusters never expose credentials to external CI/CD systems, reducing attack vectors. Automated compliance checking through Git hooks validates configurations before deployment, catching security misconfigurations early in the development process.
Implementing Horizontal Pod Autoscaler for Dynamic Workload Management

HPA Configuration with CPU and Memory Metrics
Configuring HPA Horizontal Pod Autoscaler with CPU and memory metrics requires setting baseline resource requests and defining scaling thresholds. The HPA controller monitors resource utilization and automatically adjusts replica counts based on target percentages. Start by defining CPU requests in your deployment manifests, then create HPA resources specifying target CPU utilization (typically 70-80%). Memory-based scaling works similarly but requires enabling the metrics server and setting appropriate memory requests. Configure minimum and maximum replica counts to prevent over-scaling and ensure availability during traffic spikes.
apiVersion: autoscaling/v2
kind: HorizontalPodAutoscaler
metadata:
  name: web-app-hpa
spec:
  scaleTargetRef:
    apiVersion: apps/v1
    kind: Deployment
    name: web-app
  minReplicas: 2
  maxReplicas: 10
  metrics:
  - type: Resource
    resource:
      name: cpu
      target:
        type: Utilization
        averageUtilization: 75
  - type: Resource
    resource:
      name: memory
      target:
        type: Utilization
        averageUtilization: 80
Custom Metrics Integration for Business-Specific Scaling
Custom metrics enable scaling based on business-specific indicators like queue length, request latency, or active user sessions. Implement custom metrics through Prometheus adapter or cloud provider metrics APIs. Define ServiceMonitor resources to expose application metrics, then configure HPA to use external metrics for scaling decisions. Popular custom metrics include HTTP request rate, database connection pool utilization, and message queue depth. This approach provides more accurate scaling triggers than generic CPU metrics.
apiVersion: v2
kind: HorizontalPodAutoscaler
spec:
  metrics:
  - type: External
    external:
      metric:
        name: pubsub.googleapis.com|subscription|num_undelivered_messages
        selector:
          matchLabels:
            resource.labels.subscription_id: "workqueue-subscription"
      target:
        type: AverageValue
        averageValue: "100"
Best Practices for Resource Requests and Limits
Setting accurate resource requests and limits is critical for effective HPA scaling in Production Kubernetes environments. Resource requests determine scheduling decisions and HPA baseline calculations, while limits prevent resource contention. Start with profiling your application under normal load to establish baseline requirements. Set CPU requests to average usage and limits to peak usage with 20-30% buffer. Memory requests should match typical consumption, with limits preventing OOM kills. Use vertical pod autoscaler (VPA) recommendations to fine-tune values over time.
Resource Configuration Guidelines:
- Set CPU requests to 50-70% of average usage
- Configure memory requests to match 90th percentile usage
- Implement CPU limits cautiously to avoid throttling
- Use memory limits to prevent node-level OOM conditions
- Monitor and adjust based on actual consumption patterns
Troubleshooting Common HPA Scaling Issues
HPA scaling issues often stem from missing metrics, incorrect resource requests, or misconfigured scaling policies. Check metrics server availability and verify pod resource requests are properly defined. Common problems include metrics server downtime, insufficient node capacity, and conflicting scaling policies. Debug using kubectl describe hpa to inspect scaling events and current metrics. Monitor scaling frequency to prevent thrashing by adjusting scale-up and scale-down policies. Implement proper readiness probes to ensure pods are ready before receiving traffic during scale-up events.
Troubleshooting Checklist:
- Verify metrics server is running and accessible
- Confirm pod resource requests are defined
- Check node capacity for scale-up operations
- Review HPA events for scaling decisions
- Monitor application readiness during scaling
- Validate custom metrics connectivity and permissions
Karpenter Node Autoscaling for Cost-Effective Infrastructure

Installing and configuring Karpenter in production clusters
Setting up Karpenter node autoscaling in production requires careful planning and proper IAM permissions. Install Karpenter using Helm charts with production-grade settings including IRSA (IAM Roles for Service Accounts) configuration. Configure node pools with appropriate taints, labels, and resource limits to match your workload requirements. Enable logging and monitoring through CloudWatch integration for visibility into node provisioning activities. Set up proper RBAC policies and security groups to ensure Karpenter operates within your organization’s security boundaries.
Node provisioning strategies and instance type selection
Karpenter’s intelligent node provisioning analyzes pod requirements and selects optimal instance types automatically. Configure node pools with diverse instance families including compute-optimized (C5, C6i), memory-optimized (R5, R6i), and general-purpose (M5, M6i) instances. Use requirements and node class selectors to define architecture preferences, availability zones, and capacity types. Implement topology spread constraints to ensure workloads distribute across multiple nodes and zones. Set appropriate consolidation policies to optimize resource utilization and reduce infrastructure costs through efficient bin-packing algorithms.
Spot instance integration for maximum cost savings
Spot instances with Karpenter can reduce infrastructure costs by up to 90% while maintaining application availability. Configure mixed capacity types combining on-demand and spot instances based on workload criticality. Set interruption handling policies including graceful pod eviction and node draining procedures. Use diverse spot instance pools across multiple instance families to reduce interruption impact. Implement proper pod disruption budgets and anti-affinity rules for critical workloads running on spot nodes. Monitor spot instance pricing trends and configure bidding strategies for optimal cost-performance balance.
GitOps-Driven Configuration Management for Scaling Components
Version Controlling HPA and Karpenter Configurations
Store all HPA and Karpenter configurations in Git repositories using structured YAML manifests. Create dedicated directories for scaling components, separating HPA policies from Karpenter NodePools. Use semantic versioning tags to track configuration changes and maintain audit trails. Apply GitOps configuration management principles by treating infrastructure definitions as code, enabling teams to review changes through pull requests before deployment.
Environment-specific Scaling Policies Through Git Branches
Implement branch-based strategies where each environment maintains distinct scaling configurations. Development branches can use aggressive scaling policies for testing, while production branches enforce conservative resource limits. Use Helm charts or Kustomize overlays to parameterize scaling thresholds, CPU targets, and memory limits across environments. This approach ensures consistent GitOps workflow Kubernetes practices while maintaining environment isolation.
Automated Rollback Mechanisms for Failed Deployments
Configure automated rollback triggers when scaling configurations cause cluster instability or resource exhaustion. Implement health checks that monitor pod startup times, resource utilization patterns, and application response times. Use GitOps operators like ArgoCD or Flux to automatically revert to previous known-good configurations when deployment failures occur. Set up webhook notifications to alert teams during rollback events, ensuring rapid incident response.
Monitoring Configuration Drift and Compliance
Deploy drift detection tools that continuously compare live cluster state against Git repository definitions. Use tools like Polaris or OPA Gatekeeper to enforce Kubernetes autoscaling best practices and prevent unauthorized configuration changes. Implement compliance dashboards showing alignment between intended and actual scaling policies. Configure alerts for drift events, resource quota violations, and policy deviations to maintain Production Kubernetes GitOps integrity across all scaling components.
Production Monitoring and Optimization Strategies

Key metrics for scaling performance evaluation
Tracking the right metrics separates successful Production Kubernetes monitoring from reactive firefighting. CPU utilization, memory consumption, and request latency form the foundation, but dig deeper into queue depth, pod startup times, and scaling velocity. Monitor HPA decision frequency and Karpenter node provisioning duration to catch bottlenecks before they impact users. Custom metrics like business transactions per second often trigger more meaningful scaling decisions than generic resource usage alone.
Cost tracking and optimization across auto-scaled resources
Kubernetes cost optimization requires granular visibility into your auto-scaling spend. Tag nodes provisioned by Karpenter with cost allocation labels and track spot instance savings versus on-demand usage. Monitor idle resources during scale-down events and identify workloads that frequently trigger expensive scaling cycles. Set up cost anomaly detection that alerts when scaling behavior drives unexpected expense spikes, and regularly review instance type selection to ensure Karpenter chooses the most cost-effective options for your workload patterns.
Alerting strategies for scaling failures and resource constraints
Scaling failures create cascading problems that smart alerting can prevent. Configure alerts for HPA target acquisition failures, Karpenter node provisioning timeouts, and resource quota exhaustion before they impact application performance. Watch for pods stuck in pending states, repeated scaling oscillations, and cluster capacity approaching limits. Create escalation paths that notify platform teams for infrastructure issues and application teams for workload-specific problems. Set up predictive alerts based on scaling trends to catch capacity constraints before they become critical.
Performance benchmarking and capacity planning
Establish baseline performance metrics before implementing Dynamic workload scaling Kubernetes solutions. Load test applications under various scaling scenarios to understand how quickly HPA responds and how efficiently Karpenter provisions nodes. Document scaling patterns for different workload types and seasonal traffic variations. Build capacity models that predict infrastructure needs based on business growth projections. Regular chaos engineering exercises reveal how your scaling setup handles unexpected failures and help validate that your Kubernetes autoscaling best practices actually work under pressure.

Setting up production Kubernetes with GitOps, HPA, and Karpenter creates a powerful foundation for scalable, cost-effective applications. GitOps brings the reliability of version control to your infrastructure management, while HPA automatically adjusts your pod counts based on real demand. Karpenter takes care of the heavy lifting by spinning up and down nodes as needed, keeping your costs in check without sacrificing performance.
The real magic happens when these tools work together through GitOps-driven configuration management. Your scaling policies, resource limits, and monitoring setup all live in Git, making changes trackable and rollbacks simple. Keep a close eye on your metrics and fine-tune your autoscaling thresholds regularly – this isn’t a set-it-and-forget-it solution. Start small with one application, get comfortable with the monitoring and alerting, then gradually expand to your entire production environment. Your future self will thank you for the automated scaling and the peace of mind that comes with it.