Enterprise observability transforms how organizations monitor and troubleshoot their complex systems, but unstructured logs create blind spots that cost businesses millions in downtime and lost productivity. This guide is designed for DevOps engineers, platform architects, and IT leaders who need to build robust log management systems that actually deliver insights instead of overwhelming their teams with noise.
Most companies struggle with scattered log data across dozens of services, making root cause analysis feel like searching for a needle in a haystack. Traditional log processing approaches break down at enterprise scale, leaving teams reactive instead of proactive. The shift to structured logging and modern observability platforms changes everything – giving you real-time visibility into application performance and system health.
We’ll walk through why enterprise monitoring fails when logs lack structure, explore the true costs of poor log analysis practices, and show you practical steps to implement observability best practices that scale with your business. You’ll learn how to choose the right observability platform and build log management workflows that turn data chaos into actionable intelligence.
Understanding Enterprise Observability and Its Critical Role

Defining observability beyond traditional monitoring approaches
Enterprise observability goes way beyond checking if servers are up or down. While traditional monitoring tells you what happened, observability reveals why it happened by connecting the dots across your entire technology stack. Think of it as the difference between a smoke alarm and a fire investigator – monitoring alerts you to problems, but observability helps you understand the root cause and prevent future issues.
Modern observability platforms collect telemetry data from applications, infrastructure, and user interactions to create a complete picture of system behavior. This comprehensive approach lets teams quickly identify performance bottlenecks, trace issues across distributed services, and understand how code changes impact user experience in real-time.
Key pillars of comprehensive enterprise observability
The foundation of effective enterprise observability rests on three core pillars that work together to provide complete system visibility. Metrics give you the numerical heartbeat of your systems – CPU usage, response times, and error rates that help spot trends and anomalies. Logs capture the detailed story of what’s happening inside your applications, while distributed traces follow requests as they journey through multiple services.
Metrics track quantitative data over time:
- Application performance indicators
- Infrastructure resource utilization
- Business KPIs and user engagement
- Custom metrics specific to your domain
Logs provide contextual information:
- Application events and errors
- User actions and system changes
- Security events and audit trails
- Structured logging for better analysis
Traces map request flows:
- End-to-end transaction visibility
- Service dependency mapping
- Performance bottleneck identification
- Cross-service error propagation
Business impact of poor visibility into system performance
When you can’t see what’s happening in your systems, every outage becomes a costly guessing game. Companies without proper observability spend hours hunting down issues while customers abandon shopping carts and revenue walks out the door. A single hour of downtime for a major e-commerce site can cost millions, and the ripple effects damage customer trust long after systems recover.
Poor visibility also kills developer productivity. Teams waste countless hours debugging problems they could solve in minutes with the right observability tools. This technical debt compounds over time, slowing down innovation and making it harder to deliver new features that drive business growth.
ROI benefits of implementing robust observability solutions
Smart observability investments pay for themselves quickly through reduced downtime and faster problem resolution. Teams with comprehensive visibility resolve incidents 5-10 times faster than those flying blind, directly translating to millions saved in lost revenue and productivity costs. The ability to spot performance issues before they impact users means fewer support tickets and happier customers.
Key ROI drivers include:
- Mean Time to Resolution (MTTR) reduction – from hours to minutes
- Proactive issue prevention – catching problems before customer impact
- Developer productivity gains – less time debugging, more time building
- Infrastructure optimization – right-sizing resources based on actual usage
- Compliance and security benefits – automated monitoring and alerting
- Customer satisfaction improvements – reliable, fast applications drive retention
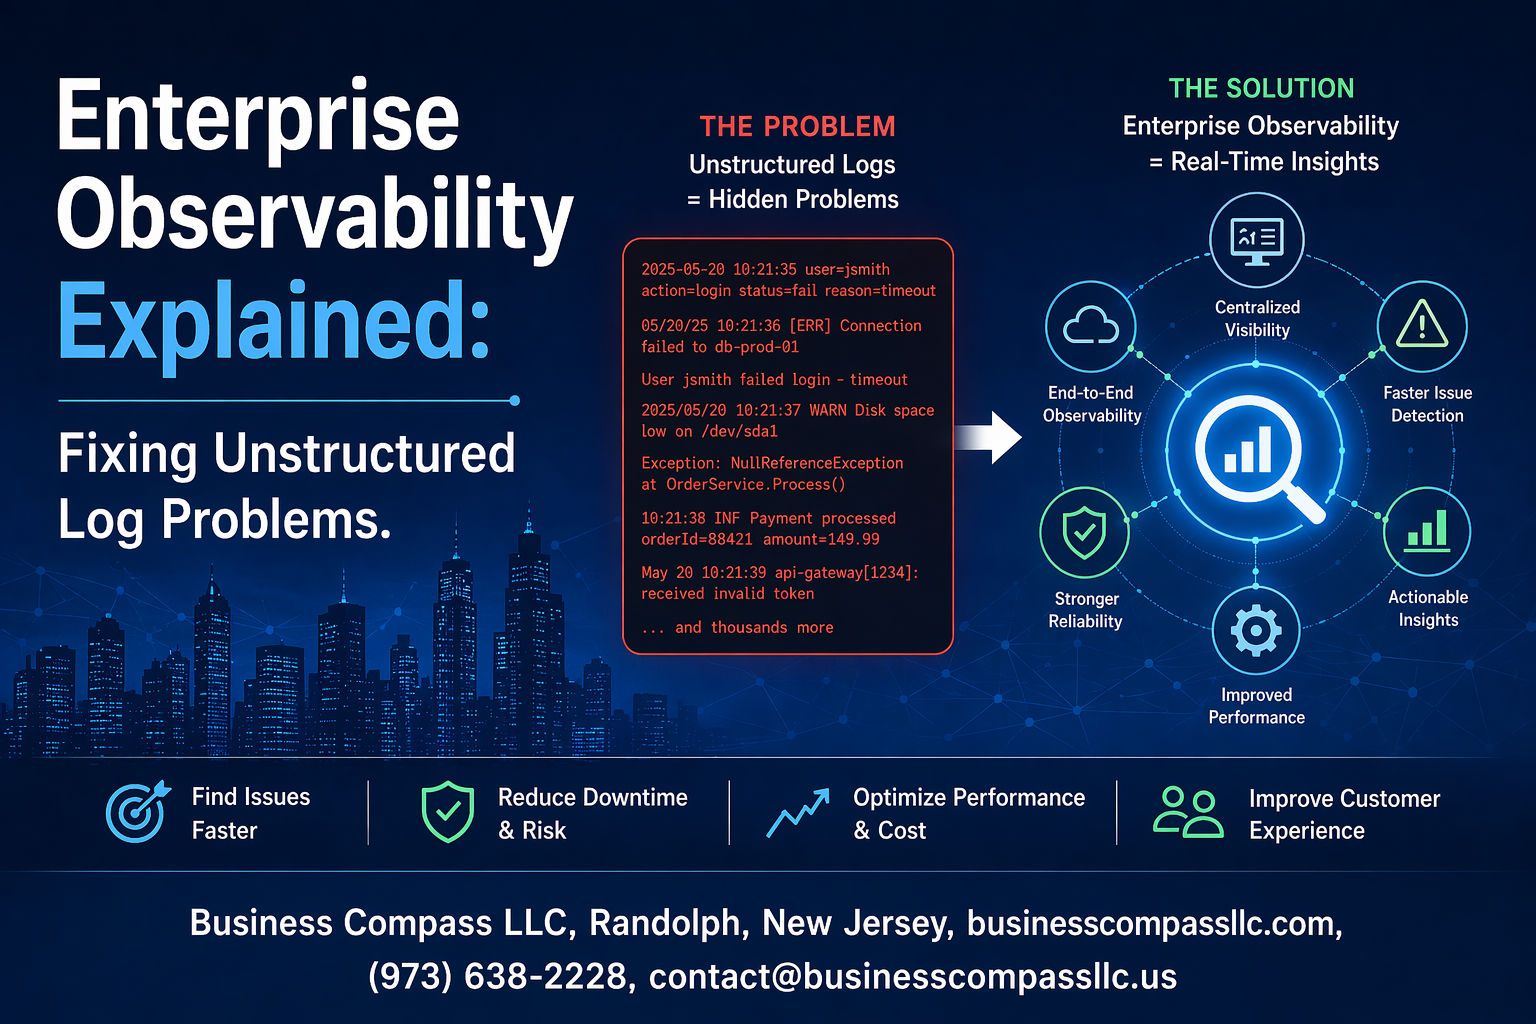
The Hidden Costs of Unstructured Log Management

Performance degradation from inefficient log processing
Unstructured logs create massive bottlenecks in enterprise monitoring systems. When logs lack consistent formatting, parsing engines work overtime to extract meaningful data, consuming significant CPU and memory resources. This inefficiency cascades through your entire observability platform, slowing down dashboards, delaying alerts, and hampering real-time analytics.
Increased mean time to resolution for critical incidents
Troubleshooting production issues becomes a nightmare when engineers must manually sift through chaotic log formats. Without structured logging, teams waste precious minutes during outages trying to correlate events across different systems. This extended detective work directly translates to longer downtimes and frustrated customers.
Resource waste from manual log analysis efforts
Engineering teams spend countless hours playing detective with unstructured logs instead of building features. Manual log analysis becomes the norm when automated tools can’t parse inconsistent formats effectively. Senior developers find themselves doing grep searches and regex gymnastics that should be handled by intelligent log management systems.
Compliance and security risks from inadequate log oversight
Regulatory requirements demand comprehensive audit trails that unstructured logs simply can’t provide reliably. Security teams struggle to identify threats when log data exists in dozens of different formats across various applications. Missing critical security events becomes inevitable when your log analysis tools can’t consistently parse and correlate suspicious activities.
Common Challenges with Traditional Log Management Systems

Volume overload and storage scalability issues
Enterprise organizations generate massive amounts of unstructured logs daily, creating storage nightmares that traditional log management systems struggle to handle. As application complexity grows, log volumes can increase exponentially, overwhelming existing infrastructure and driving storage costs through the roof. These systems often lack intelligent data retention policies, forcing teams to choose between keeping valuable historical data or managing exploding costs.
Lack of correlation between disparate log sources
Modern enterprise environments span multiple applications, services, and infrastructure components, each producing logs in different formats and locations. Traditional systems treat each log source as an isolated data silo, making it nearly impossible to trace issues across the entire technology stack. When a critical incident occurs, engineers waste precious time manually connecting dots between different log sources instead of quickly identifying root causes.
Difficulty extracting actionable insights from raw data
Raw log data sits like buried treasure – valuable but inaccessible without proper tools. Traditional log management relies heavily on manual analysis and basic search functionality, making it extremely difficult to spot patterns, trends, or anomalies that could prevent future incidents. Teams often find themselves drowning in data but starving for insights, spending hours sifting through noise to find the signal that matters.
Modern Solutions for Structured Log Processing

Automated Log Parsing and Normalization Techniques
Enterprise observability platforms now leverage advanced parsing engines that automatically identify and structure unstructured logs from diverse sources. These systems use pattern recognition algorithms and predefined templates to transform chaotic log data into consistent formats, enabling seamless analysis across applications and infrastructure components.
Real-time Log Aggregation and Centralization Strategies
Modern log management solutions deploy distributed collection agents that stream data to centralized processing hubs with millisecond latency. High-throughput ingestion pipelines handle millions of events per second while maintaining data integrity and implementing intelligent buffering mechanisms to prevent data loss during network disruptions or system overload scenarios.
Machine Learning-Powered Anomaly Detection Capabilities
AI-driven observability platforms continuously learn normal system behavior patterns and automatically flag deviations that indicate potential issues. These systems reduce false positives by analyzing historical trends and correlating anomalies across multiple metrics, enabling proactive incident response before problems impact end users or business operations.
Context-Aware Alerting and Intelligent Noise Reduction
Smart alerting systems prioritize notifications based on business impact and historical correlation patterns. They suppress redundant alerts during cascading failures and group related events into single, actionable incidents. Dynamic thresholds adjust automatically based on seasonal patterns and application deployment cycles, ensuring teams focus on genuine threats.
Implementation Best Practices for Enterprise-Grade Observability

Establishing effective log retention and archival policies
Smart retention policies balance cost control with compliance requirements. Define retention periods based on data criticality – keep high-value application logs for 30-90 days in hot storage, then archive to cold storage for regulatory compliance. Automated lifecycle management reduces manual overhead while ensuring your observability platform maintains optimal performance.
Creating standardized logging formats across applications
Structured logging transforms chaotic log streams into actionable insights. Implement JSON-based formats with consistent field naming conventions across all applications. This standardization enables automated log analysis and reduces time-to-resolution during incidents. Your development teams will thank you when debugging becomes predictable rather than painful.
Building cross-team collaboration workflows for incident response
Break down silos by establishing shared runbooks and escalation paths. Create dedicated Slack channels that automatically receive alerts from your enterprise monitoring systems. Define clear ownership for different service components and establish on-call rotations. This collaborative approach accelerates mean time to recovery and prevents finger-pointing during critical outages.
Measuring and optimizing observability tool effectiveness
Track key metrics like alert noise ratio, false positive rates, and incident detection time. Regular reviews help identify gaps in your observability best practices and highlight areas needing improvement. Monitor tool adoption across teams and gather feedback to refine configurations. Effective measurement turns your observability investment into a competitive advantage rather than just another operational expense.

Dealing with unstructured logs is like trying to find a needle in a haystack while blindfolded. Enterprise observability transforms this chaos into clear, actionable insights that help teams spot issues before they become critical problems. When you properly structure your log data and implement the right tools, you’re not just fixing technical debt – you’re building a foundation for reliable, scalable systems that your business can count on.
The investment in modern observability solutions pays for itself through reduced downtime, faster troubleshooting, and better team productivity. Start small with one critical system, focus on standardizing your log formats, and gradually expand your observability coverage. Your future self will thank you when that 3 AM alert comes with all the context you need to fix the problem quickly instead of spending hours digging through scattered log files.