Looking to streamline your machine learning operations on Databricks? This guide is for data scientists, ML engineers, and DevOps professionals who want to build robust MLOps practices in their Databricks environment. We’ll cover essential strategies for setting up efficient CI/CD pipelines that automate your ML workflows, implementing effective model governance to ensure compliance and reproducibility, and establishing monitoring systems that keep your models performing at their best. Follow these recommendations to transform how your team delivers ML projects from development to production on the Databricks platform.
Understanding MLOps Fundamentals on Databricks

Key MLOps Concepts and Their Importance in ML Lifecycles
Machine learning isn’t a one-and-done deal. It’s a living, breathing process that demands ongoing attention. That’s where MLOps comes in.
MLOps is basically DevOps for machine learning. It connects development and operations teams to streamline how ML models move from idea to production. On Databricks, this translates to managing your entire ML lifecycle in one place.
The core concepts you need to know:
- Version Control: Track changes to your code, data, and models so you don’t lose your mind wondering which experiment worked
- Continuous Integration/Deployment: Automatically test and deploy model updates without manual headaches
- Model Registry: A centralized hub where models are versioned, transitioned through stages, and documented
- Reproducibility: Ensuring that your entire pipeline can be recreated consistently
- Monitoring: Keeping tabs on model performance and data drift in production
Without these practices, most ML projects crash and burn before reaching production. Or worse—they make it to production but silently degrade without anyone noticing.
How Databricks Uniquely Positions MLOps Workflows
Databricks isn’t just another platform—it’s practically built for MLOps.
The magic happens because Databricks combines data engineering, analytics, and ML in one unified environment. No more awkward handoffs between teams or tools.
What makes Databricks stand out:
- Lakehouse Architecture: Combines data lake storage with warehouse capabilities, giving you the best of both worlds for ML data
- MLflow Integration: Built-in experiment tracking, model registry, and deployment tools that just work
- Notebook-First Collaboration: Data scientists, engineers, and analysts can work in the same environment using familiar tools
- Managed Compute: Scale resources up or down without infrastructure headaches
- Delta Lake Integration: Ensures data quality and reliability with ACID transactions
The platform essentially eliminates the usual friction points in ML pipelines. When your data scientists discover something valuable, the path to production isn’t a mysterious black box—it’s a well-lit highway.
Benefits of Implementing MLOps on Databricks Platform
Putting MLOps into practice on Databricks pays off big time.
First off, you’ll slash your time-to-value. Models that used to take months to deploy can now go live in days or even hours. One financial services company cut their model deployment time by 75% after adopting Databricks MLOps practices.
The concrete benefits include:
- Cost Reduction: Autoscaling compute resources mean you only pay for what you use
- Accelerated Experimentation: Run parallel experiments without resource conflicts
- Simplified Compliance: Built-in governance tools make audit trails and documentation automatic
- Improved Model Quality: Better testing and validation leads to more robust models
- Reduced Technical Debt: Standardized practices prevent the accumulation of one-off solutions
Teams also report better collaboration across disciplines. Data engineers, scientists, and analysts stop working in silos and start speaking the same language.
Common Challenges and Their Solutions
Even with a powerful platform like Databricks, MLOps isn’t always smooth sailing.
Challenge #1: Skills Gap
Many data scientists excel at building models but struggle with production engineering principles.
Solution: Use Databricks’ built-in CI/CD templates and MLflow’s simplified deployment APIs to reduce the engineering burden.
Challenge #2: Data Quality Issues
Garbage in, garbage out—and ML amplifies the problem.
Solution: Implement Delta Lake quality checks and expectations to catch problems before they reach your models.
Challenge #3: Model Drift
Models that worked yesterday might fail tomorrow as data patterns change.
Solution: Set up automated monitoring with Databricks’ Model Serving feature to track prediction drift and trigger retraining.
Challenge #4: Governance at Scale
As you add more models, keeping track of everything becomes overwhelming.
Solution: Leverage Databricks’ Unity Catalog for fine-grained access control and the MLflow Model Registry for centralized governance.
The most successful organizations don’t try to solve everything at once. They start with one critical model, implement MLOps practices end-to-end, then expand from there.
Setting Up Your MLOps Environment

A. Configuring Databricks workspaces for optimal MLOps
Setting up your Databricks workspace right from the start saves tons of headaches down the road. Trust me on this one.
First, organize your workspace with a clear folder structure:
/Production– for deployed models/Staging– for models under evaluation/Development– for experimental work
Tag everything obsessively. I’m talking compute resources, notebooks, jobs, and clusters. When your ML projects multiply, you’ll thank yourself for this level of organization.
Create separate compute clusters for different workloads:
- Development clusters (autoscaling, shorter timeouts)
- Training clusters (optimized for GPU workloads)
- Inference clusters (right-sized for production loads)
Don’t skimp on setting up cluster policies. They’re your guardrails to prevent runaway costs while giving data scientists the horsepower they need.
B. Essential tools and integrations for your MLOps stack
Your Databricks MLOps toolbox isn’t complete without these key components:
- MLflow – The backbone of your ML lifecycle management
- Delta Lake – For reliable data versioning and reproducibility
- Databricks Repos – Git integration directly in your workspace
- Databricks Workflows – Orchestration for complex pipelines
- Feature Store – Centralized feature management
These aren’t optional extras. They’re the difference between ad-hoc experiments and production-ready ML systems.
Connect your Databricks environment to:
- CI/CD tools like GitHub Actions or Azure DevOps
- Container registries for model serving
- Monitoring solutions like Prometheus or Datadog
The magic happens when these tools talk to each other. Automate everything you can.
C. Role-based access control for collaborative development
Nobody wants the wild west when it comes to ML models and data access.
Start with these baseline roles:
- ML Engineers – Access to development workspace, limited production access
- Data Scientists – Development access, limited data access permissions
- MLOps Engineers – Full pipeline access, deployment permissions
- Business Stakeholders – Read-only dashboard access
Don’t just use the default Databricks roles. Create custom roles that match your team’s actual workflow. Too many permissions? You’ve got shadow IT and security issues. Too few? Your team can’t move fast.
Use Databricks’ notebook access control features to guard sensitive code or models. Remember – proper RBAC isn’t about restriction, it’s about enabling the right people to do their jobs safely.
D. Infrastructure as code approaches for Databricks resources
Manually clicking through the Databricks UI to set up resources? That’s a recipe for disaster.
Get comfortable with these IaC options:
- Terraform for Databricks workspace provisioning
- Databricks CLI for resource automation
- Databricks REST API for programmatic control
Here’s what your IaC should define:
- Workspace configurations
- Cluster definitions
- Job specifications
- Secret scopes
- Notebook permissions
Store these configurations in Git alongside your model code. This way, your infrastructure evolves with your ML solutions.
When someone asks “how did we configure that production cluster?” your answer should never be “I think we added some libraries and changed some settings a few months ago.” It should be “check the terraform module in our repo.”
E. Version control integration best practices
Version control isn’t optional in MLOps. It’s oxygen.
Connect Databricks Repos to your Git provider and follow these practices:
- One repo per project or domain
- Branch protection for main/production branches
- PR reviews required for all merges
- Automated testing triggered on commits
Don’t just version your code. Version:
- Notebook workflows
- Data preprocessing steps
- Model configurations
- Environment dependencies
- Deployment manifests
Create a branching strategy that works for your team’s size. For smaller teams, a simple main/development approach works. Larger teams might need feature branching or GitFlow.
Remember to use .gitignore files properly. Nothing kills collaboration faster than accidental commits of massive datasets or API keys.
Model Development and Experimentation

Leveraging Databricks notebooks for reproducible experiments
Most data scientists know this pain: you built a model that worked perfectly yesterday, but today? Total mess. Nothing runs. Databricks notebooks solve this headache by packaging code, documentation, and outputs together.
The secret sauce is the ability to schedule notebook runs, parameterize them, and track versions. Ever need to roll back to yesterday’s working model? Just click through your revision history.
Try this approach:
- Split notebooks into modular functions
- Use notebook widgets for interactive parameter tuning
- Comment liberally about your thought process
- Leverage %run to import functions from other notebooks
Notebooks make collaboration actually workable. Your teammates can see your visualizations and comment directly on your code – goodbye endless email threads trying to explain why your random forest is better than their gradient boosting.
Tracking experiments efficiently with MLflow
MLflow isn’t just another tool – it’s your experiment lifesaver when you’re drowning in model versions.
Within Databricks, MLflow tracking is built right in. No extra config, no deployment headaches. Every model run gets logged automatically, which means you can finally answer “which learning rate worked best again?”
What to track:
- Parameters (learning rates, epochs, etc.)
- Metrics (accuracy, F1 score, RMSE)
- Artifacts (feature importance plots, confusion matrices)
- Model files (for easy deployment later)
The real game-changer? The parallel coordinates plot. See at a glance how different parameter combinations affected your metrics across dozens of runs.
Optimizing hyperparameter tuning processes
Hyperparameter tuning without a strategy is just expensive guesswork. Databricks offers several approaches that won’t drain your compute budget.
Grid search is nice but wasteful. Try these instead:
- Bayesian optimization with Hyperopt
- Multi-armed bandits for efficiently exploring parameter space
- Early stopping criteria to kill obviously bad runs
A smart approach is starting with a coarse grid search on a sample of your data. Once you’ve narrowed down promising regions, use Bayesian methods on the full dataset.
Databricks autoscaling really shines here – parallelize your hyperparameter search across a cluster that grows and shrinks as needed.
Managing dependencies and environments
Environment inconsistency is the silent killer of ML projects. “Works on my machine” doesn’t cut it when deploying to production.
Databricks offers several ways to wrangle dependencies:
- Cluster libraries for team-wide package management
- Init scripts for complex setups
- Docker containers for complete isolation
For Python projects, requirements.txt files are bare minimum. Better yet, use conda environments with explicit version pinning.
The killer feature? Databricks Runtime ML images – pre-configured environments with optimized ML libraries that just work together. No more “TensorFlow and CUDA version mismatch” errors at 2AM.
CI/CD Pipelines for ML on Databricks
Building automated testing frameworks for ML models
Building tests for ML models isn’t like testing regular software. ML models can be… unpredictable.
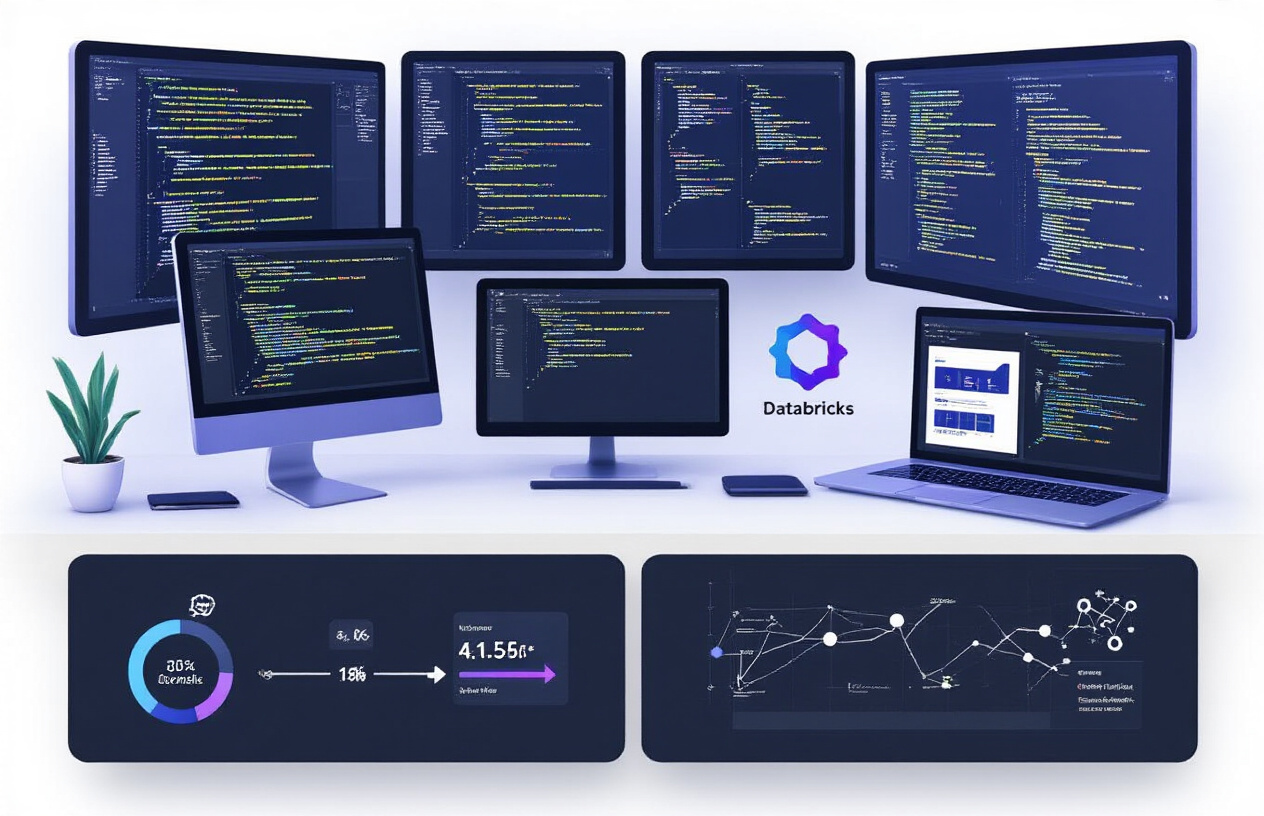
On Databricks, you’ll want to set up multiple testing layers:
- Unit tests for individual components (data preprocessing, feature engineering)
- Integration tests to verify pipeline connections
- Model validation tests to catch performance regressions
Here’s a practical approach:
# Example of a model validation test
def test_model_performance(trained_model, test_dataset):
    predictions = trained_model.predict(test_dataset)
    accuracy = accuracy_score(test_dataset.labels, predictions)
    assert accuracy >= 0.85, "Model accuracy below threshold"
Use Databricks Notebooks to organize your test suites – they support both interactive development and automated execution through the Databricks Jobs API.
IV. Implementing continuous integration workflows
CI workflows on Databricks should trigger automatically when code changes hit your repo. No one wants to manually kick off testing after every commit, right?
Set up your CI pipeline to:
- Pull the latest code from your repository
- Create an isolated testing environment
- Run your test suite against multiple datasets
- Generate performance reports
- Block merges if tests fail
GitHub Actions or Azure DevOps integrate nicely with Databricks. Here’s a simple GitHub workflow that runs tests when PRs are created:
name: ML Model Tests
on: [pull_request]
jobs:
  test:
    runs-on: ubuntu-latest
    steps:
      - uses: actions/checkout@v2
      - name: Run Databricks notebook
        uses: databricks/run-notebook@v1
        with:
          notebook-path: "/Tests/run_all_tests"
          databricks-host: $
          databricks-token: ${{ secrets.DATABRICKS_TOKEN }}
Deployment strategies that minimize downtime
Nobody likes when systems go down during deployments. For ML models on Databricks, these strategies work best:
Blue-Green Deployment:
Keep two identical environments – only one serves production traffic. Deploy to the inactive environment, test thoroughly, then switch traffic over. If something breaks, just flip back.
Canary Releases:
Roll out your model to a small percentage of users first. Monitor like a hawk. If all looks good, gradually increase the percentage until you reach 100%.
Shadow Mode:
Run your new model alongside the current one, but only log the new model’s predictions without actually using them. Compare the results before fully deploying.
Databricks Model Serving makes this easier with its REST API and versioning capabilities:
client.create_endpoint(
    name="my-model-endpoint",
    config={
        "served_models": [{
            "model_name": "my_model",
            "model_version": "2",  # New version
            "workload_size": "Small",
            "scale_to_zero_enabled": True
        }]
    }
)
Monitoring pipeline health and performance
Your CI/CD pipeline itself needs monitoring – not just your models.
Track these metrics to catch issues early:
- Pipeline run duration (trending longer? something’s wrong)
- Success/failure rates (watch for spikes in failures)
- Resource consumption (memory usage, compute costs)
- Test coverage (are you testing enough?)
Databricks Jobs provides built-in monitoring capabilities, but consider setting up alerts for when things go sideways. Nobody wants to discover at 2 AM that pipelines have been failing for hours.
For advanced monitoring, stream job events to tools like Datadog or Prometheus using webhooks:
client.create_job_webhook(
    job_id=job_id,
    webhook={
        "id": "notification-webhook",
        "url": "https://monitoring.example.com/webhook",
        "events": ["run-start", "run-failure"]
    }
)
Model Governance and Management
Implementing model registry for version control
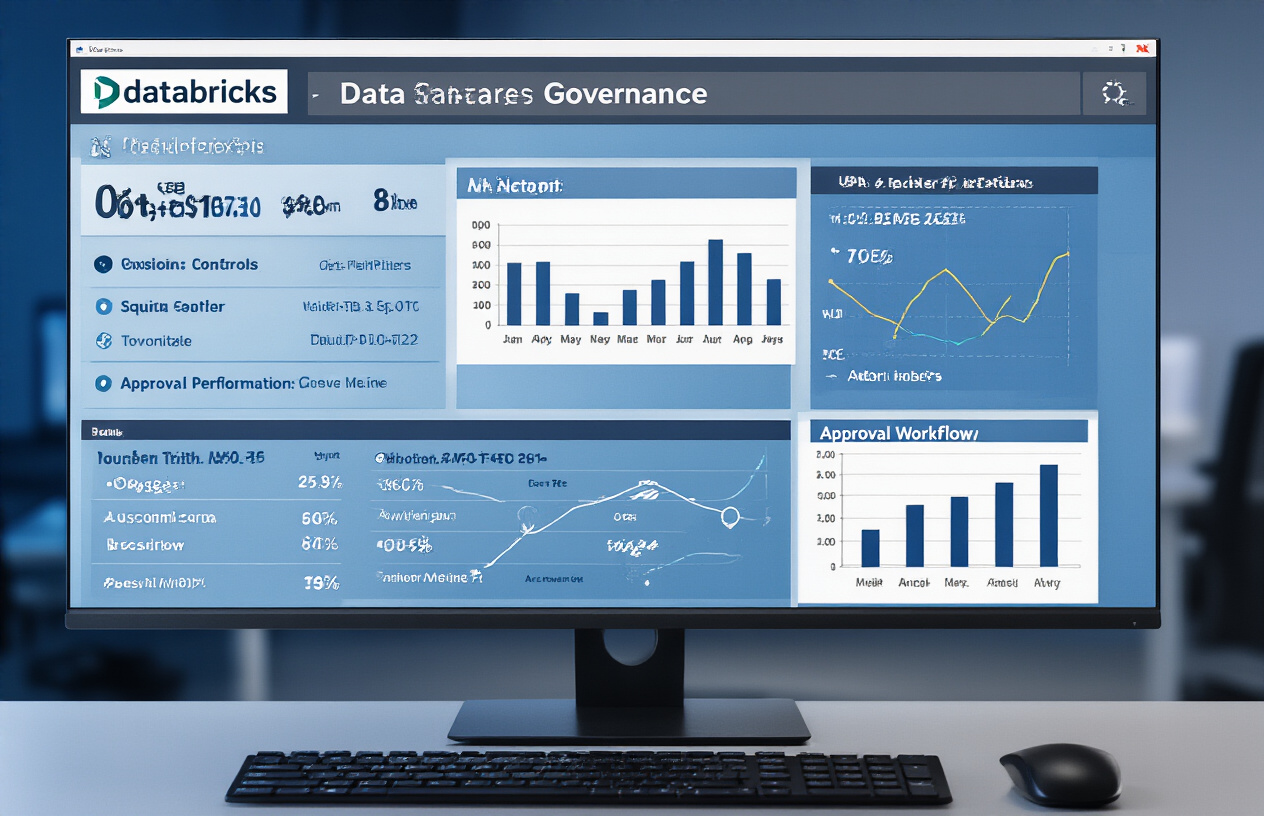
Ever tried to remember which model version you used three months ago? Yeah, that nightmare ends with a proper model registry. On Databricks, the Model Registry isn’t just nice-to-have – it’s your ML sanity keeper.
The Model Registry tracks:
- Model lineage (where did this thing come from?)
- Training metrics (how good is it actually?)
- Input schemas (what does it expect?)
- Dependencies (what breaks if I update something?)
Setting it up is straightforward:
model_name = "recommendation_engine"
mlflow.register_model(f"runs:/{run_id}/model", model_name)
But the real magic happens when you tag versions with stages like “Production,” “Staging,” or “Archived” – giving you a clear picture of what’s where.
Creating approval workflows for production models
Nobody wants rogue models hitting production. Databricks lets you create approval workflows that make sure the right people sign off before anything goes live.
Your workflow might look like:
- Data scientist registers a promising model
- Team lead reviews performance metrics
- ML engineer validates operational requirements
- Compliance officer checks regulatory boxes
- Final approval pushes to production
The transition API makes this clean:
client = mlflow.tracking.MlflowClient()
client.transition_model_version_stage(
    name="recommendation_engine",
    version=4,
    stage="Production"
)
Documentation practices that enhance collaboration
Documentation is boring until you’re stuck debugging a model at 2 AM. Then it’s priceless.
Great documentation on Databricks includes:
- Model cards with intended use cases and limitations
- Data profiles showing what the model was trained on
- Performance benchmarks across different segments
- Expected drift parameters
- Explicit callouts for sensitive features
Databricks notebooks make this easier with their ability to mix code, visualizations, and markdown. Pin critical notebooks to make them findable.
Add comments directly to model versions:
client.create_model_version_comment(
    name="recommendation_engine",
    version=4,
    comment="Improved conversion rate by 12% on test segment"
)
Compliance and regulatory considerations
ML compliance isn’t sexy but it keeps you employed. Databricks has several features to keep regulators happy:
Tracking immutable model lineage ensures you can answer “how did you get this prediction?” years later. Workspace access controls and audit logs prove who did what and when.
For regulated industries, set up:
- Automated model risk assessment scores
- Fairness metrics for sensitive attributes
- Explainability reports using SHAP values
- Data retention policies aligned with regulations
- Approval workflows with mandatory sign-offs
Built-in Unity Catalog provides fine-grained permissions:
spark.sql("GRANT USAGE ON CATALOG ml_models TO data_science_team")
Scheduled model validation jobs can continuously verify your models still meet compliance thresholds even as data drifts.
Monitoring and Observability

Setting up real-time model performance dashboards
Getting visibility into your ML models isn’t a luxury – it’s a necessity. On Databricks, you can build powerful real-time dashboards that keep you informed without the headache.
Start by leveraging Databricks SQL Analytics to create custom visualizations that track key metrics. The secret sauce? Connect your MLflow tracking server directly to your dashboard to stream evaluation metrics as they happen.
# Quick example of setting up a metric tracker
from mlflow.tracking import MlflowClient

client = MlflowClient()
dashboard_metrics = client.get_metric_history(run_id, "accuracy")
Most teams find success with a combination of:
- Model accuracy and loss trends
- Prediction distribution visualizations
- Feature importance over time
- Latency and throughput stats
Don’t overcomplicate your dashboards. The best ones show exactly what you need – nothing more, nothing less.
Detecting and alerting on data and concept drift
Drift happens. Your job is to catch it before it wrecks your models.
On Databricks, you’ve got options for tracking both data drift (when input patterns change) and concept drift (when the relationship between inputs and outputs shifts).
The simplest approach? Set up automated monitoring jobs using Delta tables:
# Basic drift detection with statistical tests
with mlflow.start_run():
    drift_detector = DriftDetector(reference_data=baseline_df)
    drift_detector.monitor(production_data)
    if drift_detector.has_drift():
        send_alert("Drift detected in production model!")
Practical tip: don’t just detect drift – understand it. Databricks’ visualization tools help you pinpoint exactly which features are drifting and how.
Set sensitivity thresholds that make sense for your business. Too sensitive? You’ll drown in alerts. Too loose? You’ll miss critical shifts.
Implementing feedback loops for continuous improvement
Your models should get better over time, not worse. That’s where feedback loops come in.
The game-changer on Databricks is implementing automated retraining pipelines that kick in when performance dips below thresholds. Here’s how smart teams do it:
- Capture ground truth data in Delta tables
- Compare predictions against actuals
- Trigger retraining workflows when accuracy falls
- A/B test new models against current champions
# Simple feedback loop implementation
def evaluate_and_retrain():
    current_performance = get_model_metrics()
    if current_performance < acceptable_threshold:
        trigger_databricks_job("model_retraining")
Make sure your feedback mechanisms are appropriate for your use case. Financial fraud models might need daily retraining, while manufacturing prediction systems might need monthly updates.
Resource utilization and cost optimization techniques
Databricks isn’t free, and MLOps can get expensive fast if you’re not careful.
First, autoscaling is your friend. Configure your clusters to scale down when idle:
# Cluster configuration snippet
autoscale:
  min_workers: 2
  max_workers: 8
Other cost-saving strategies that pay off:
- Schedule jobs during off-peak hours
- Use spot instances for non-critical workloads
- Cache frequently accessed datasets
- Implement model compression for inference
A practical approach I’ve seen work well: create separate clusters for development, training, and inference. Each has different resource needs, and this separation prevents your expensive GPU resources from sitting idle.
Monitor your spending with Databricks’ cost analysis tools. You’d be surprised how often a forgotten notebook is quietly burning through your budget.
Scaling MLOps Practices on Databricks

A. Strategies for managing multiple models in production
Ever tried juggling five balls at once? Managing multiple ML models in production on Databricks feels pretty similar.
The key is organization. Use model registry tags and aliases religiously – they’re lifesavers when you’re tracking which model version is doing what. Something like:
client.set_model_tag("recommendation_engine", "department", "marketing")
Create separate service principals for different model workloads. This keeps permissions clean and troubleshooting simple.
Another game-changer? Implement a consistent naming convention across all models:
| Component | Format | Example |
|---|---|---|
| Model name | department_usecase_algorithm | marketing_churn_xgboost |
| Experiment | project_subproject | customer_retention_phase2 |
Don’t manually track your models – automate the inventory process. A simple daily job that catalogs active models, their performance metrics, and dependency versions saves countless headaches down the road.
B. Handling large-scale feature stores effectively
Feature stores become unwieldy fast. I’ve seen teams crash and burn trying to manage them manually at scale.
First rule of Databricks feature stores: partition intelligently. Time-based partitioning works for most use cases:
features_table = spark.write.format("delta").partitionBy("date").saveAsTable("features.customer_behavior")
Cache frequently accessed features using Databricks’ cache API. Your inference pipelines will thank you when they’re running 5x faster.
For massive feature sets, implement feature pruning as part of your pipeline. Track feature importance scores and archive features that haven’t proven valuable. No sense paying for compute on useless columns.
Consider implementing a feature compute schedule based on update frequency:
| Feature Type | Update Frequency | Example |
|---|---|---|
| Static | Monthly/Never | Customer DOB |
| Slowly changing | Daily/Weekly | Avg purchase value |
| Real-time | Hourly/Minutes | Cart abandonment |
C. Automating retraining processes
Manual retraining is for amateurs. Serious MLOps teams on Databricks automate this completely.
Set up Delta Live Tables to trigger retraining when data drift exceeds thresholds:
@dlt.table
def model_drift_metrics():
    return spark.sql("SELECT feature, abs(current_mean - baseline_mean)/baseline_mean as drift FROM feature_stats")
Databricks Jobs are perfect for scheduling regular retraining. Chain them together for end-to-end pipelines that:
- Detect drift
- Retrain if necessary
- Run A/B tests against current champion
- Auto-promote if performance improves
Track training metrics over time with MLflow autologging. This builds a historical performance record that proves invaluable during troubleshooting.
Biggest mistake teams make? Forgetting to version their training datasets alongside models. Always tag which data version produced which model version.
D. Cross-team collaboration frameworks
Breaking down silos makes or breaks MLOps success on Databricks.
Unity Catalog is your friend here – it provides a shared, secure space for cross-functional teams. Data scientists, engineers, and analysts can all access the same trusted data assets with appropriate permissions.
For day-to-day collaboration, Databricks notebooks with widget parameters work brilliantly. Data engineers can build data processing notebooks that data scientists can simply parameterize and run:
dbutils.widgets.text("date_range", "30d", "Processing Period")
Create a central model evaluation dashboard using Databricks SQL. Every stakeholder should see the same performance metrics – no more arguments about whose numbers are right.
Standardize your Git workflow across teams. Whether using repos directly in Databricks or external CI/CD, consistency prevents merge headaches.
E. Enterprise-wide MLOps standardization
Scaling MLOps across an enterprise requires ruthless standardization.
Create a central “MLOps Cookbook” repository with notebook templates for common patterns:
- Model training template
- Feature engineering template
- Deployment notebook
- Monitoring setup
Build custom utilities for repeated tasks and publish as wheels to your Databricks artifact repository.
Standardize cluster configurations using cluster policies – this prevents resource waste and ensures reproducibility.
Create role-based access patterns:
| Role | Unity Catalog Permissions | MLflow Permissions |
|---|---|---|
| ML Engineer | Manage Models | Create, Register Models |
| Data Scientist | Read/Write Tables | Experiment, Register |
| Analyst | Read Tables, Read Models | Read Experiments |
Automated compliance checks are essential. Use webhooks to validate models meet governance requirements before production promotion.
Most important – document everything in a central knowledge base. The best MLOps standards are useless if teams can’t find and follow them.

Successfully implementing MLOps on Databricks requires a comprehensive approach spanning environment setup, model development, CI/CD pipelines, governance, and monitoring. By establishing proper foundations in each of these areas, organizations can streamline their machine learning lifecycle, reduce technical debt, and ensure models deliver consistent business value. The integration of Delta Lake, MLflow, and Databricks’ unified analytics platform provides the technical infrastructure needed for enterprise-grade MLOps.
As you embark on your MLOps journey with Databricks, remember that successful implementation is an iterative process. Start with foundational practices, measure improvements in deployment frequency and model performance, and gradually scale your approach. With proper attention to governance, monitoring, and team collaboration, your organization will be well-positioned to transform ML experiments into production-ready solutions that drive meaningful business outcomes.
