


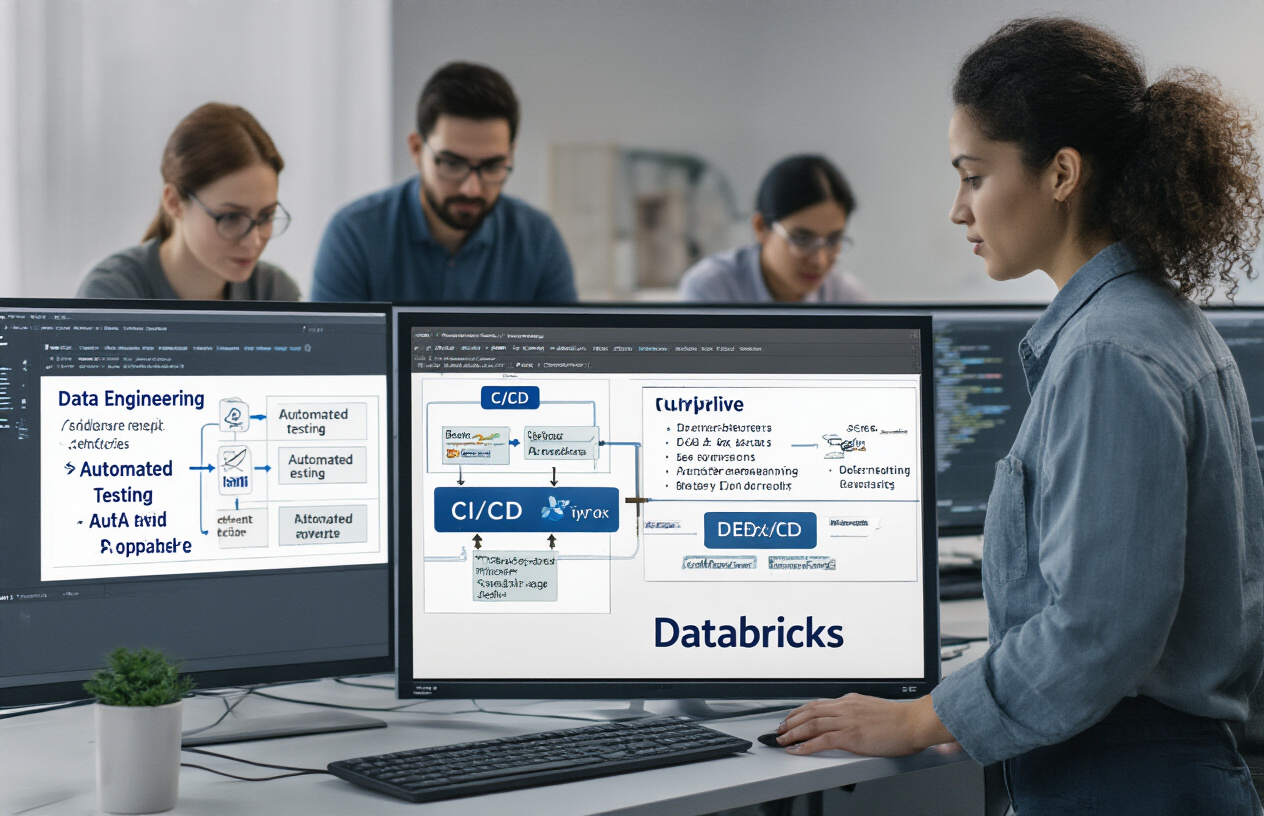
Implementing reliable CI/CD workflows in Databricks helps data engineers and MLOps teams deliver better code faster. This guide walks through practical strategies to automate testing and deployment of your Databricks projects, reducing manual errors and speeding up releases.
We’ll cover setting up your Databricks CI/CD environment with the right tools and configurations, then explore how to build effective testing frameworks that catch issues before they reach production. You’ll also learn automated deployment workflows that work seamlessly with Databricks’ unique architecture.
Perfect for data teams already familiar with Databricks who want to adopt DevOps best practices in their data and ML pipelines.
Understanding CI/CD Fundamentals in Databricks
Key CI/CD concepts and their importance in data engineering
CI/CD isn’t just for app developers anymore. Data engineers need this stuff too, especially when working with Databricks.
At its core, Continuous Integration means automatically testing your code changes against your main codebase. For Databricks projects, this means validating your notebooks, jobs, and data pipelines before they break something important.
Continuous Deployment takes things a step further by automatically pushing those validated changes to production environments. No more manual uploads or forgotten steps.
The stakes are higher in data engineering. A bad deployment isn’t just an app crash—it can mean corrupted data, failed ETL jobs, or inaccurate analytics that business leaders use for decisions.
How CI/CD workflows differ in Databricks environments
Databricks throws some curveballs at traditional CI/CD approaches:
- Notebook-based development: Unlike pure code repositories, Databricks uses notebooks that combine code, documentation, and visualizations
- Cluster configurations: Your code doesn’t just need to work—it needs to work on specific cluster types with specific libraries
- Job scheduling: Changes might affect scheduled jobs running mission-critical processes
- Delta Lake considerations: Version control needs to handle both code and data changes
You can’t just copy-paste CI/CD patterns from software engineering. Databricks requires specialized approaches for testing notebooks, managing library dependencies, and handling cluster configurations.
Benefits of implementing CI/CD for Databricks projects
Teams that nail CI/CD in Databricks see massive gains:
- Faster iterations: Changes move from development to production in hours instead of days
- Fewer data pipeline failures: Automated testing catches the stupid mistakes we all make
- Consistent environments: No more “works on my cluster” problems
- Better collaboration: Multiple data engineers can work on the same project without stepping on each other’s toes
- Audit trails: Every change is tracked, tested and documented
The productivity boost alone makes CI/CD worth it. One team I worked with cut their release cycle from two weeks to twice daily after implementing proper CI/CD.
Common challenges teams face without proper CI/CD workflows
The pain points get real when CI/CD is missing:
- The midnight emergency: Someone pushed untested code that broke the nightly data pipeline
- Configuration drift: Production environment slowly becomes different from development until things mysteriously break
- The bus factor problem: Only one person knows how to deploy certain projects
- Deployment amnesia: Steps forgotten during manual deployments cause inconsistent results
- Rollback nightmares: When something breaks, there’s no clean way to return to a working state
Without CI/CD, data teams spend more time fighting fires than building valuable data products. And the larger your Databricks implementation grows, the worse these problems become.
Setting Up Your Databricks CI/CD Environment

A. Essential tools and configurations for successful implementation
Building a solid CI/CD pipeline in Databricks starts with the right toolkit. You’ll need:
- Databricks CLI: Your command-line best friend for automating workspace tasks
- Databricks REST API: Powers your programmatic interactions with Databricks
- Notebooks Export Format: Choose between DBC, SOURCE, or HTML based on your needs
- DBX: An open-source CLI tool that extends Databricks CLI functionality
- Databricks Connect: Lets your local IDE talk directly to Databricks clusters
Don’t overlook setting up proper authentication with service principals instead of personal access tokens. It’s a rookie mistake that’ll bite you later.
# Example configuration for Databricks CLI
databricks configure --token
# Set your workspace URL and access token when prompted
B. Integrating version control systems with Databricks
Git integration isn’t optional anymore—it’s essential. Here’s how to do it right:
- Connect your Databricks workspace to GitHub, Azure DevOps, or Bitbucket
- Implement branching strategies that match your team’s workflow
- Store notebooks as .py or .ipynb files—not proprietary formats
- Use pull requests for code reviews before merging to main branches
The magic happens when you sync your repo changes with your workspace:
# Sync your Git repo with Databricks workspace
databricks workspace import_dir /local/path /Workspace/path
C. Configuring workspace environments for development, testing and production
Separate environments keep things clean. Period.
| Environment | Purpose | Configuration |
|---|---|---|
| Dev | Experimentation, rapid iteration | Small clusters, auto-termination |
| Test | Integration testing, validation | Mirror prod specs, isolated data |
| Prod | Live workloads | Fixed-size clusters, high availability |
Use workspace-level Databricks repos to maintain separation:
/Repos
  /dev
  /test
  /prod
D. Role-based access control best practices for CI/CD pipelines
Security matters, so lock it down properly:
- Create dedicated service accounts for CI/CD operations
- Implement least privilege principles—give access only to what’s needed
- Use groups for role management instead of individual permissions
- Separate permissions for CI/CD pipeline operators vs. data scientists
Key roles to define:
- Pipeline Operators: Can deploy code but not modify prod data
- Data Engineers: Full access to dev, limited in prod
- Platform Admins: Manage workspace but not necessarily data
E. Infrastructure-as-code approaches for Databricks resources
Stop clicking around the UI to set up resources. Codify everything:
- Use Terraform to provision and manage Databricks workspaces
- Define clusters with JSON or YAML configurations
- Create job definitions as code artifacts
- Implement automated secrets management
Terraform makes infrastructure changes trackable and repeatable:
resource "databricks_cluster" "shared_autoscaling" {
  cluster_name            = "Shared Autoscaling"
  spark_version           = "11.3.x-scala2.12"
  node_type_id            = "Standard_DS3_v2"
  autotermination_minutes = 20
  autoscale {
    min_workers = 1
    max_workers = 10
  }
}
Building Effective Testing Frameworks

Unit Testing Strategies for Databricks Notebooks and Jobs
Testing in Databricks isn’t something you bolt on as an afterthought. It’s the backbone of reliable data engineering.
For unit testing notebooks, I recommend using the unittest framework with notebook-level isolation. Here’s a practical approach:
def test_transformation_function():
    input_data = spark.createDataFrame([("John", 30), ("Alice", 25)], ["name", "age"])
    result = transformation_function(input_data)
    expected = spark.createDataFrame([("John", "30"), ("Alice", "25")], ["name", "age_string"])
    assert result.collect() == expected.collect()
When testing jobs, mock your dependencies. Databricks now supports pytest fixtures that simulate production environments without touching actual data. This prevents those painful “it worked on my machine” moments.
Notebook widgets make parameterized testing a breeze:
dbutils.widgets.text("test_mode", "True")
is_test = dbutils.widgets.get("test_mode") == "True"

if is_test:
    # Use sample data
else:
    # Use production data
Data Validation Testing to Ensure Pipeline Integrity
Data validation goes beyond just checking if your code runs. It verifies your data maintains its integrity throughout the pipeline.
Great Data Quality (DQ) tests in Databricks look for:
- Schema drift – Has a column type changed unexpectedly?
- Volume thresholds – Is record count within expected ranges?
- Null proportions – Are missing values at acceptable levels?
- Business rule compliance – Do values conform to domain rules?
Implement these using Great Expectations or Databricks’ built-in assertion functions:
# Check for nulls in critical columns
assert df.filter(df.customer_id.isNull()).count() == 0, "Found null customer IDs!"

# Verify expected data volumes
row_count = df.count()
assert 1000 <= row_count <= 1500, f"Data volume outside expected range: {row_count}"
Performance Testing Methodologies for Databricks Workloads
Performance testing is where many Databricks pipelines fall apart. The secret? Test with production-scale data.
Start by capturing baseline metrics:
- Execution time
- Memory usage per executor
- Shuffle data size
- Spark UI stage metrics
Then implement a load testing framework. I use this pattern:
start_time = time.time()
result = large_scale_transformation(test_df)
execution_time = time.time() - start_time

# Log performance metrics
log_metrics(execution_time, spark.sparkContext.getExecutorMemoryStatus())
Pro tip: Test cluster autoscaling behavior by progressively increasing data volume. The insights you’ll gain on scaling inefficiencies are pure gold.
Automated Regression Testing for Complex Data Transformations
Complex transformations are regression-prone beasts. Tame them with snapshot testing.
Here’s my favorite approach for Databricks:
- Store golden dataset snapshots in Delta tables
- Run your transformations on control inputs
- Compare results against golden datasets using DataFrame equality checks
def test_complex_transformation():
    # Run transformation on known input
    result = complex_business_logic(input_df)

    # Load golden dataset
    expected = spark.read.format("delta").load("/golden_datasets/expected_output")

    # Compare all columns and rows (or use custom comparison logic)
    differences = result.exceptAll(expected).union(expected.exceptAll(result))
    assert differences.count() == 0, "Transformation output doesn't match golden dataset"
Automated regression tests should run on every PR. Nothing catches subtle bugs faster.
Automating Deployment Workflows

A. Implementing notebook deployment automation
Ever tried manually deploying dozens of notebooks across multiple environments? It’s a nightmare. Automation is your best friend here.
Start by creating a CI/CD pipeline that automatically deploys notebooks when changes are pushed to your repository. Tools like the Databricks CLI and REST API make this surprisingly simple:
# Example of notebook deployment via Databricks CLI
databricks workspace import "/local/path/to/notebook.py" "/Shared/Production/notebook" \
    --language python --format SOURCE --overwrite
Better yet, use the Databricks Terraform provider to manage notebooks as code:
resource "databricks_notebook" "my_notebook" {
  path     = "/Production/MyNotebook"
  language = "PYTHON"
  content_base64 = filebase64("${path.module}/notebooks/my_notebook.py")
}
This approach ensures your notebooks move consistently between dev, staging, and production environments with zero manual intervention.
B. Job scheduling and orchestration best practices
Timing is everything in deployment workflows. Random deployments during peak hours? Recipe for disaster.
Set up a dedicated job orchestration strategy with these principles:
- Schedule deployments during low-traffic periods
- Use parameterized jobs for flexibility across environments
- Implement dependency chains to ensure proper execution order
{
  "name": "Production Data Pipeline",
  "tasks": [
    {
      "task_key": "data_ingestion",
      "notebook_task": {
        "notebook_path": "/Production/data_ingestion",
        "base_parameters": {
          "environment": "production"
        }
      }
    },
    {
      "task_key": "data_transformation",
      "depends_on": [
        {
          "task_key": "data_ingestion"
        }
      ],
      "notebook_task": {
        "notebook_path": "/Production/data_transformation"
      }
    }
  ]
}
The secret sauce? Databricks Workflows with its DAG-based approach ensures everything runs in the right order, every time.
C. Managing dependencies across environments
Dependencies can make or break your deployment. That inconsistent behavior between environments? Usually dependency chaos.
Create a dependency management strategy with:
- Environment-specific library configuration files
- Version pinning for critical packages
- Centralized package repositories
For Python dependencies, use a requirements.txt file with exact versions:
pandas==1.5.3
scikit-learn==1.2.2
delta-spark==2.4.0
For JARs and other libraries, consider using the Databricks Libraries API to automate installation:
import requests

response = requests.post(
    f"{workspace_url}/api/2.0/libraries/install",
    headers={"Authorization": f"Bearer {token}"},
    json={
        "cluster_id": cluster_id,
        "libraries": [{"pypi": {"package": "pandas==1.5.3"}}]
    }
)
Track everything in Git to ensure you can reproduce any environment at any time.
D. Strategies for zero-downtime deployments
Nobody likes downtime. Your users certainly don’t.
Blue-green deployment is your secret weapon in Databricks. Maintain two identical environments (blue and production) and one staging environment. Deploy changes to the staging environment, test thoroughly, then to the blue environment. Once verified, switch traffic from production to blue, making blue the new production.
For job deployments, use a shadow-testing approach:
- Create a duplicate job with the new code
- Run both jobs in parallel, comparing outputs
- Once verified, disable the old job and enable the new one
This approach gives you confidence that everything works before users ever see it.
E. Rollback mechanisms for failed deployments
Things go wrong. It’s not if, but when.
Always keep multiple versions of your assets available for quick rollback. For notebooks, leverage Databricks’ built-in versioning:
# Rollback to previous version using the Databricks API
import requests

response = requests.post(
    f"{workspace_url}/api/2.0/workspace/export",
    headers=
    json={
        "path": "/Shared/Production/critical_notebook",
        "format": "SOURCE",
        "version_id": previous_version_id  # Specify the version to roll back to
    }
)
For jobs, maintain a version history in your CI/CD pipeline and automate the rollback process. The key is speed – you want to minimize the impact of a failed deployment.
Remember to set up automated monitoring to detect deployment failures early. The sooner you know something’s wrong, the faster you can roll back.
Advanced CI/CD Patterns for Databricks

Feature branching strategies for data engineering teams
Ever tried merging complex data pipeline code only to break everything? Yeah, not fun.
Feature branching in Databricks isn’t just nice-to-have—it’s essential when multiple engineers work on the same codebase. The trick is finding the right balance between isolation and integration.
Here’s what works for most teams:
| Strategy | Best For | Challenges |
|---|---|---|
| GitFlow | Larger teams, release cycles | Can become heavyweight |
| Trunk-based | Fast iterations, CI focus | Requires disciplined testing |
| GitHub Flow | Feature-focused work | Needs solid PR reviews |
Pick GitHub Flow if you’re just starting. Create a branch from main, develop your feature (say, a new data transformation), and merge back through a PR. Simple but effective.
For Databricks specifically, name your branches with clear prefixes like feature/, fix/, or refactor/ followed by the ticket number. This helps Databricks Repos organize your work logically.
Quick tip: set up notebook-level permissions that align with your branching strategy. This prevents the classic “who changed my production notebook?” panic attacks.
Using Delta Live Tables in your CI/CD pipeline
Delta Live Tables (DLT) change the game for CI/CD in Databricks. They bring declarative pipeline definitions that are much easier to version control and test than traditional notebooks.
The magic happens when you treat DLT pipelines as code artifacts. Here’s how:
- Store your DLT SQL or Python definitions in your git repo
- Automate tests against sample data
- Deploy through infrastructure-as-code templates
One approach that’s worked well:
/
  /pipelines
    /bronze_to_silver
      pipeline.py
      expectations.py
      test_data/
    /silver_to_gold
      pipeline.sql
      test_data/
  /deployment
    pipeline_config.json
This structure lets you test each pipeline layer independently. Your CI system can verify that expectations are met before promoting code.
What’s neat is DLT’s expectations feature integrates perfectly with testing frameworks. Write expectations like CONSTRAINT valid_id EXPECT (id IS NOT NULL) and your CI/CD pipeline can automatically validate data quality.
Implementing canary deployments for critical workloads
Let’s talk real—pushing straight to production is scary. Especially with data pipelines that feed business-critical dashboards.
Canary deployments in Databricks let you gradually roll out changes while monitoring for issues. The concept is simple: direct a small percentage of your workload through the new code before full deployment.
For Databricks workloads, implement this with:
- Create a duplicate job with your new code
- Route a subset of data (maybe 5-10%) through this canary job
- Compare outputs and performance metrics
- Gradually increase traffic if all looks good
This works particularly well with scheduled Databricks jobs. For example:
# In your deployment script
if is_canary:
    job_config["name"] = f"{original_name}_canary"
    job_config["schedule"]["quartz_cron_expression"] = "0 0/30 * * * ?" # Every 30 min
Add monitoring that compares record counts, schema changes, and data distributions between your canary and production jobs. Set alert thresholds for significant deviations.
Multi-region deployment considerations
Running Databricks across multiple regions isn’t just for the cloud architecture nerds anymore—it’s becoming standard practice for global organizations.
Your CI/CD pipeline needs to handle deployment across regions while maintaining consistency. A few patterns to consider:
- Centralized pipeline, distributed deployment: Build once, deploy to all regions sequentially
- Regional build pipelines: Separate pipelines per region with shared code base
- Blue-green deployments across regions: Deploy to secondary regions first, then primary
Data residency requirements often complicate things. Your pipeline should be smart enough to know which data can move between regions and which must stay put.
Set up your CI/CD configuration to parameterize region-specific settings:
{
  "deployment": {
    "us-west": {
      "warehouse_id": "abc123",
      "data_access_pattern": "local_only"
    },
    "eu-central": {
      "warehouse_id": "def456",
      "data_access_pattern": "federated"
    }
  }
}
Don’t forget about latency—testing in one region doesn’t guarantee performance in another. Your CI/CD pipeline should include performance benchmarks specific to each deployment region.
Monitoring and Optimizing Your CI/CD Pipeline

Key metrics to track for CI/CD pipeline health
Pipeline health isn’t just about whether things are running – it’s about how well they’re running. Here are the metrics you should be obsessing over:
- Build Success Rate: Track the percentage of successful builds. Anything below 90% is a red flag.
- Mean Time to Recovery (MTTR): How quickly can you fix a broken pipeline? This directly impacts your team’s productivity.
- Deployment Frequency: Are you deploying daily or weekly? Higher frequency usually means smaller, safer changes.
- Lead Time: The time from code commit to production deployment. Shorter is better.
- Test Coverage: Not just how much code is tested, but are you testing the right things?
I’ve seen teams cut their pipeline failures in half just by putting these metrics on a dashboard. Numbers don’t lie.
Implementing observability for deployed workflows
Blind spots will kill your Databricks workflows. You need three layers of observability:
- Infrastructure Monitoring: CPU, memory, cluster utilization, and job run costs
- Application Metrics: Job run time, data processed, and failure rates
- Business Impact Metrics: Data freshness, accuracy, and availability for end users
Set up Databricks Workflow alerts that actually mean something. Skip the noise – alert on patterns, not one-off issues.
Add instrumentation to your notebooks with proper logging. “It works on my machine” doesn’t cut it anymore.
Continuous feedback loops for pipeline improvement
Your CI/CD pipeline should get better with age, not worse. Here’s how to make that happen:
- Retrospectives after failures: What broke? Why? How can we prevent it?
- Regular pipeline reviews: Gather the team monthly to review metrics and identify bottlenecks.
- User feedback channels: Create a Slack channel where data consumers can report issues.
- Automated test results analysis: Look for flaky tests that fail intermittently.
The magic happens when you close the loop. Don’t just collect feedback – actually implement changes based on it.
Cost optimization strategies for test and deployment resources
Databricks costs can spiral if you’re not careful. Smart teams do this:
- Right-size your clusters: Use the smallest cluster that gets the job done.
- Implement auto-termination: Don’t leave test clusters running overnight.
- Schedule pipeline runs strategically: Do you really need hourly runs, or would daily suffice?
- Cache test data: Regenerating test datasets for every run is expensive.
- Use Delta caching: Speed up tests and reduce compute with smart caching.
My favorite trick? Tag your resources with the team name and project. Then review costs weekly. You’ll be shocked how quickly you’ll find savings when everyone sees the bill.
Real-World Success Stories and Lessons Learned

Case study: Enterprise-scale CI/CD implementation
Ever wonder what happens when a Fortune 500 financial services company decides to overhaul their entire analytics infrastructure with Databricks? I spoke with the lead architect at FinanceCorp (name changed) who shared their journey.
Before implementing proper CI/CD, their data scientists were spending 40% of their time just managing code deployments. Code conflicts were a daily headache, and production outages happened twice a month on average.
Their solution? A custom-built CI/CD pipeline that:
- Automated testing across 200+ notebooks
- Implemented branch protection in Git
- Created separate DEV/QA/PROD workspaces
- Used infrastructure-as-code for workspace provisioning
The results were stunning:
- Deployment time dropped from 3 days to 45 minutes
- Production incidents decreased by 87%
- Developer productivity increased by 35%
“We didn’t just implement tools,” their architect told me. “We changed our culture. That was the hard part.”
Common pitfalls and how to avoid them
I’ve seen teams crash and burn with Databricks CI/CD. Here are the traps you need to dodge:
Too much, too fast. Teams try implementing everything at once. Instead, start with version control, then add automated testing, then deployment automation.
Ignoring dependencies. Databricks notebooks have complex dependencies on clusters, libraries, and data. Track them all or you’ll break things silently.
The permission maze. Databricks’ permissions can be a nightmare for CI/CD. Map out access controls early and use service principals for automation.
Neglecting testing. Data pipelines need specialized testing. Build validation for schema drift, data quality, and performance.
Forgetting observability. Without proper monitoring, you’ll never know if your pipeline is actually working in production.
Measuring ROI from CI/CD implementation
The bosses want numbers. Here’s what to track:
Time metrics:
- Deployment frequency (weekly → daily → hourly)
- Lead time (from commit to production)
- Mean time to recovery (when things break)
Quality metrics:
- Failed deployment percentage
- Pipeline reliability rate
- Data quality scores
One healthcare client tracked these metrics religiously and proved their CI/CD investment paid for itself in just 4 months. They reduced their infrastructure costs by 22% by automatically spinning down resources after testing.
The secret? Baseline measurements. You can’t show improvement without knowing where you started.
Future trends in Databricks CI/CD workflows
The Databricks CI/CD landscape is evolving fast. Keep an eye on:
GitOps everything. The trend toward declarative configurations for entire Databricks environments is picking up steam.
AI-powered testing. ML models are starting to generate test cases and predict where pipeline failures might occur.
Cross-platform orchestration. Expect tighter integration between Databricks workflows and tools like Airflow and GitHub Actions.
Shift-left security. Security scanning is moving earlier in the development process, with automated checks before code even leaves a developer’s workspace.
Unified MLOps and DataOps. The artificial boundary between model deployment and data pipeline deployment is disappearing.
Teams that stay ahead of these trends will have a massive competitive advantage. The days of treating Databricks as just another notebook environment are over.

Implementing robust CI/CD workflows in Databricks transforms how data engineering teams deliver value. From understanding CI/CD fundamentals to setting up your environment, building testing frameworks, and automating deployments, these practices significantly enhance code quality and delivery speed. The advanced patterns we’ve explored, along with monitoring strategies, provide a framework for continuous improvement of your data pipelines.
As you apply these best practices to your Databricks projects, remember that successful CI/CD adoption is an iterative process. Start small, measure results, and gradually expand your automation footprint. The real-world success stories demonstrate that organizations embracing these principles experience fewer production issues, faster innovation cycles, and more collaborative data teams. Take the first step today by implementing one of these practices in your next Databricks project.


