


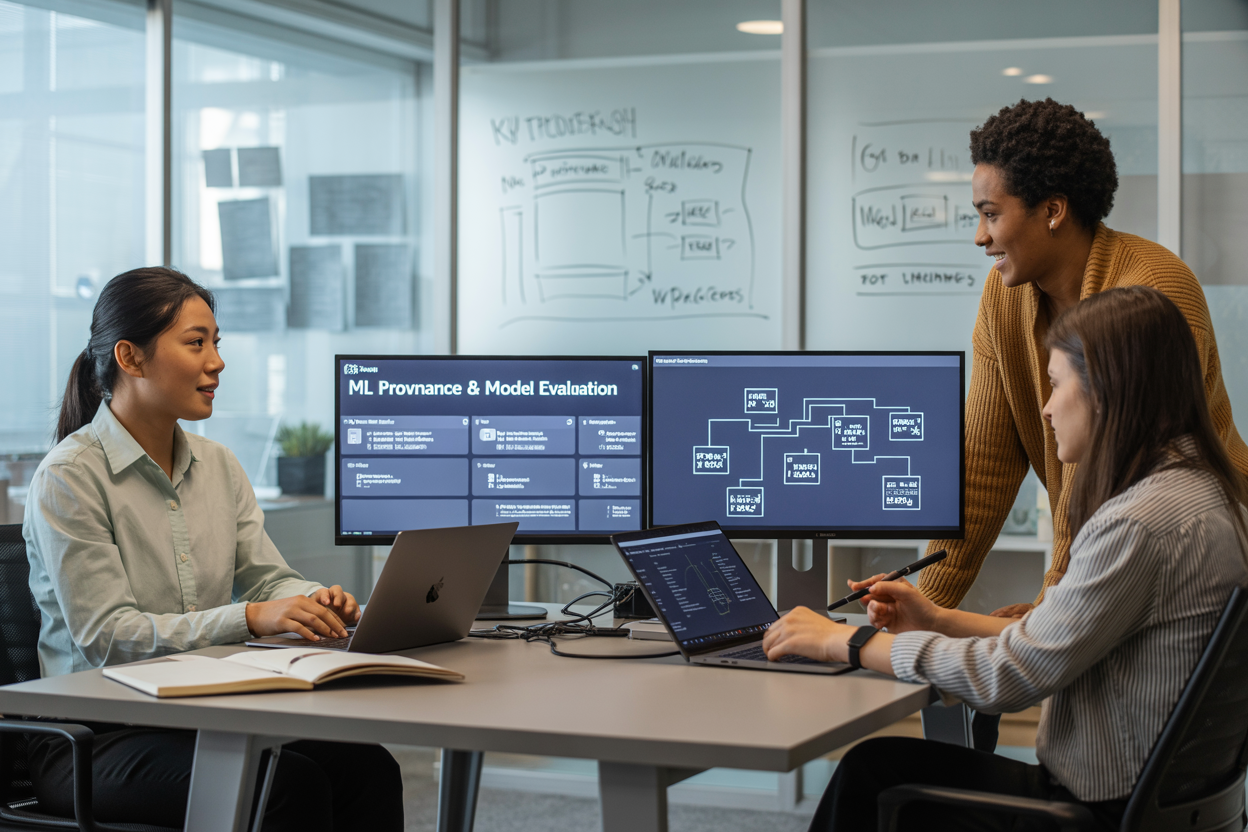
Tracking machine learning models from training to production gets messy fast, especially when you’re working with foundation models and complex ML pipelines. SageMaker Lineage and Bedrock Model Evaluation solve this chaos by giving you complete ML provenance tracking and model quality assessment throughout your entire development process.
This guide is for ML engineers, data scientists, and MLOps teams who need to maintain visibility and control over their AWS machine learning workflows while ensuring foundation model evaluation meets production standards.
We’ll walk through how SageMaker Lineage creates complete ML workflow visibility so you can trace every artifact and decision in your pipeline. Then we’ll dive into Bedrock Model Evaluation for automated model evaluation of foundation models, helping you catch quality issues before they reach users. Finally, we’ll show you how to build systems that support ML operations scaling by combining both tools for end-to-end machine learning lifecycle management.
Understanding SageMaker Lineage for Complete ML Workflow Visibility
Track data transformations and feature engineering processes automatically
SageMaker Lineage captures every step of your data transformation pipeline without requiring manual documentation. When you process raw datasets through feature engineering pipelines, the service automatically logs each transformation, creating a complete audit trail. This includes preprocessing steps like normalization, encoding categorical variables, and creating derived features.
The lineage tracking extends to distributed processing frameworks like Apache Spark and SageMaker Processing jobs. Every input dataset, transformation script, and output artifact gets recorded with timestamps and metadata. You can trace back from any feature in your final training dataset to see exactly how it was created and which upstream data sources contributed to it.
| Transformation Type | Automatically Tracked Elements |
|---|---|
| Data Preprocessing | Input files, transformation scripts, output datasets |
| Feature Engineering | Feature creation logic, parameter values, computed features |
| Data Validation | Quality checks, anomaly detection results, approval gates |
Monitor model training experiments and hyperparameter changes
ML workflow visibility becomes crucial during the experimentation phase where multiple training runs happen with different configurations. SageMaker Lineage automatically captures hyperparameter settings, training algorithms, and performance metrics for each experiment. This creates a searchable history that helps teams understand which configurations led to better model performance.
The system tracks relationships between training jobs and their associated artifacts like training scripts, Docker images, and compute resources. When you run hyperparameter tuning jobs, lineage connects parent tuning jobs with individual training attempts, making it easy to analyze patterns across successful configurations.
Training experiment tracking includes:
- Algorithm selection and version information
- Hyperparameter combinations and their impact on metrics
- Training duration and resource consumption
- Model checkpoints and intermediate artifacts
Establish clear connections between datasets, code, and model artifacts
Building robust ML provenance tracking requires understanding how datasets, code repositories, and model artifacts connect throughout the development lifecycle. SageMaker Lineage creates these connections automatically when you use SageMaker’s managed services, but you can also register custom artifacts and relationships.
The lineage graph shows bidirectional relationships between entities. You can start from a deployed model and trace backward to see which datasets were used for training, or begin with a dataset and track forward to see all models that used that data. This visibility helps with compliance requirements and debugging production issues.
Key artifact relationships include:
- Data lineage: Raw data → processed features → training datasets
- Code lineage: Source repositories → training scripts → model artifacts
- Model lineage: Training experiments → model versions → deployment endpoints
Enable reproducibility through comprehensive workflow documentation
Reproducibility in machine learning depends on capturing enough context to recreate any model or experiment. SageMaker Lineage automatically documents the complete execution environment, including software versions, container images, and infrastructure configurations used during training and inference.
The service maintains version history for all tracked entities, allowing you to recreate historical states of your ML workflow. This documentation extends beyond just storing metadata – it preserves the actual computational environment through container registries and code snapshots.
AWS machine learning teams benefit from automated documentation that includes:
- Execution environments with exact package versions
- Data snapshots and schema evolution over time
- Model performance baselines and regression testing results
- Approval workflows and governance decisions
The comprehensive workflow documentation supports both technical reproducibility and business compliance requirements. Teams can demonstrate model development processes to auditors while having the technical details needed to recreate models for debugging or retraining purposes.
Implementing Bedrock Model Evaluation for Foundation Model Quality

Set up automated evaluation pipelines for large language models
Building robust automated evaluation pipelines for foundation models starts with defining clear objectives and establishing the right infrastructure. Bedrock Model Evaluation provides a comprehensive framework for continuous assessment of large language models without manual intervention.
The pipeline architecture centers around event-driven evaluation triggers. When new model versions become available or when specific time intervals pass, the system automatically initiates evaluation workflows. Configure Amazon EventBridge to orchestrate these triggers, connecting Bedrock services with evaluation datasets stored in S3.
Key components include data preprocessing modules that format evaluation datasets into the required format, inference endpoints that handle model requests at scale, and result aggregation services that compile metrics across multiple test scenarios. The pipeline should support both synchronous and asynchronous evaluation modes to accommodate different model sizes and complexity requirements.
# Example pipeline configuration
evaluation_config = {
    "model_variants": ["claude-3", "titan-text"],
    "datasets": ["reasoning", "summarization", "qa"],
    "frequency": "daily",
    "parallel_executions": 4
}
Integration with AWS machine learning services enables seamless scaling. Use SageMaker Processing jobs for compute-intensive evaluations and Lambda functions for lightweight metric calculations. This hybrid approach optimizes both cost and performance while maintaining evaluation consistency across different foundation models.
Measure model performance using standardized benchmarks and metrics
Standardized benchmarks provide consistent measurement baselines for foundation model evaluation across different use cases and model architectures. Popular benchmarks include GLUE for natural language understanding, HellaSwag for commonsense reasoning, and MMLU for multitask language understanding.
| Benchmark Category | Key Metrics | Use Cases |
|---|---|---|
| Language Understanding | F1 Score, Accuracy | Classification, NER |
| Text Generation | BLEU, ROUGE, BERTScore | Summarization, Translation |
| Reasoning | Exact Match, Partial Credit | Math, Logic Problems |
| Safety & Bias | Toxicity Rate, Fairness Metrics | Content Moderation |
Custom metrics often prove more valuable than generic benchmarks for specific business applications. Domain-specific evaluation datasets that reflect real-world usage patterns provide deeper insights into model performance. Create evaluation sets that mirror actual user inputs, including edge cases and adversarial examples.
Automated model evaluation systems should track both primary metrics (accuracy, fluency) and secondary indicators (latency, cost per token, resource utilization). This comprehensive approach reveals trade-offs between model quality and operational efficiency, enabling informed decisions about model selection and deployment strategies.
Implement statistical significance testing to validate performance differences between models. A/B testing frameworks help distinguish genuine improvements from random variations, especially when comparing models with similar baseline performance.
Compare multiple foundation models for specific use cases
Effective model comparison requires structured evaluation frameworks that account for task-specific requirements and business constraints. Model quality assessment goes beyond simple accuracy measurements to include factors like consistency, robustness, and alignment with specific use case requirements.
Create comparison matrices that evaluate models across multiple dimensions simultaneously. Consider computational requirements, licensing costs, fine-tuning capabilities, and integration complexity alongside performance metrics. This holistic approach reveals which models deliver the best value for specific applications.
{
  "comparison_framework": {
    "technical_performance": ["accuracy", "latency", "throughput"],
    "business_factors": ["cost_per_request", "licensing", "support"],
    "operational_aspects": ["deployment_complexity", "monitoring", "scaling"]
  }
}
Multi-model evaluation pipelines enable parallel testing across different foundation models using identical datasets and evaluation criteria. This approach eliminates bias from sequential testing and provides direct performance comparisons. Configure Bedrock to route identical prompts to multiple models simultaneously, then aggregate and compare results.
Use stratified sampling to ensure evaluation datasets represent diverse user scenarios. Test models on different complexity levels, input lengths, and domain-specific content to identify strengths and weaknesses across various use cases. Document which models excel in specific scenarios to guide future model selection decisions.
Monitor model drift and performance degradation over time
Continuous monitoring systems detect subtle changes in model behavior that might indicate drift or degradation. ML operations scaling requires automated detection mechanisms that flag performance issues before they impact production systems.
Baseline establishment involves capturing initial performance metrics across representative test sets, then tracking deviations over time. Set up monitoring dashboards that visualize performance trends, highlighting both gradual drift and sudden performance drops. Configure alerts for metrics that fall below predetermined thresholds.
Drift detection algorithms compare current model outputs with historical baselines using statistical tests and distribution analysis. Jensen-Shannon divergence and Kolmogorov-Smirnov tests effectively identify changes in output distributions. Population stability index (PSI) tracks input data drift that might affect model performance.
| Monitoring Strategy | Detection Method | Alert Threshold |
|---|---|---|
| Output Distribution | JS Divergence | > 0.1 |
| Response Quality | Human Evaluation Score | < 85% |
| Latency Monitoring | P95 Response Time | > 2x baseline |
| Error Rate Tracking | Failed Requests | > 5% increase |
Implement automated retraining triggers when drift exceeds acceptable limits. ML workflow visibility through comprehensive logging enables quick diagnosis of performance issues. Track both model-level metrics and request-level details to identify patterns in degradation.
Regular human evaluation cycles complement automated monitoring by capturing qualitative aspects that metrics might miss. Schedule periodic reviews where human evaluators assess model outputs for coherence, relevance, and appropriateness, providing feedback that automated systems cannot detect.
Building End-to-End ML Provenance Tracking Systems
Integrate lineage tracking from data ingestion to model deployment
Creating a comprehensive ML provenance tracking system requires capturing every touchpoint across your machine learning pipeline. SageMaker Lineage provides the backbone for this tracking, automatically recording relationships between data sources, processing steps, model artifacts, and deployments.
Start by instrumenting your data ingestion pipelines to register datasets and their transformations in the lineage graph. When raw data enters your system through S3 buckets or other sources, SageMaker automatically creates lineage records that track data movement and processing steps. This creates a clear chain of custody from source data to processed features.
Processing jobs and feature engineering steps become trackable entities in the lineage system. Each transformation creates new artifacts linked to their inputs, building a detailed dependency graph. Training jobs automatically connect to their input datasets and produce model artifacts with full traceability back to source data.
Model deployment endpoints maintain connections to their underlying model versions, creating an unbroken chain from raw data to production predictions. This comprehensive tracking enables rapid root cause analysis when model performance degrades or data quality issues arise.
The system captures metadata at each step, including data schemas, processing parameters, and environmental configurations. This rich context makes debugging easier and supports impact analysis when changes propagate through your ML workflow.
Create audit trails for regulatory compliance and governance
Regulatory environments demand detailed documentation of ML model development and deployment decisions. SageMaker Lineage automatically generates audit trails that satisfy compliance requirements across industries like healthcare, finance, and manufacturing.
The lineage tracking system maintains immutable records of who accessed what data, when models were trained, and which versions were deployed to production. These records include user identities, timestamps, and change reasons, creating a comprehensive audit log that regulatory bodies can review.
Model governance becomes straightforward when you can trace any prediction back to its training data and processing steps. The audit trail shows data lineage, model parentage, and deployment history in a format suitable for compliance reporting. This visibility helps organizations demonstrate that models were developed following approved methodologies and using authorized data sources.
Data privacy compliance benefits from lineage tracking that shows exactly which personal information influenced model training. When data subjects request information about automated decision-making, the audit trail provides clear documentation of data usage and model behavior.
Risk management teams can use audit trails to assess model dependencies and potential failure points. The system tracks relationships between models, making it easier to identify cascading risks when shared components experience issues.
Establish version control for models, data, and experimental configurations
Effective ML provenance tracking requires robust version control that extends beyond traditional code versioning. SageMaker integrates with MLflow and other model registries to provide comprehensive versioning for all ML artifacts.
Model versioning captures training code, hyperparameters, and resulting artifacts in a single versioned entity. Each model version links to specific data versions and processing configurations, creating reproducible training runs. This approach ensures that any model version can be rebuilt exactly using the same inputs and parameters.
Data versioning tracks changes to datasets over time, enabling teams to understand how data evolution affects model performance. The system maintains snapshots of training datasets and feature stores, linking each model to its exact training data version. This capability proves essential when investigating performance degradation or reproducing historical results.
Experimental configuration versioning captures the complete environment state for each training run. This includes Docker images, dependency versions, and infrastructure configurations. The comprehensive versioning enables true reproducibility across different environments and team members.
| Component | Versioning Method | Benefits |
|---|---|---|
| Models | Semantic versioning with artifact hashing | Reproducible deployments and rollbacks |
| Data | Content-based snapshots with lineage | Historical analysis and debugging |
| Code | Git integration with experiment tracking | Full development history |
| Environment | Container image versioning | Consistent execution environments |
Branch-based development becomes possible for ML workflows when all components support versioning. Teams can experiment with different approaches while maintaining stable production versions. The version control system tracks merges and conflicts across data, models, and configurations, enabling collaborative development at scale.
Optimizing Model Quality Assessment Throughout Development Lifecycle
Implement continuous validation during model training phases
Setting up continuous validation during model training requires integrating SageMaker Lineage tracking with real-time evaluation metrics. Configure automated validation checkpoints that trigger after each training epoch or predetermined intervals. Use SageMaker’s built-in metrics logging to capture accuracy, loss, and custom business metrics throughout the training process.
Create validation pipelines that automatically test model performance against holdout datasets and compare results to baseline models. Bedrock Model Evaluation can assess foundation models during fine-tuning phases, ensuring quality standards are maintained even as models adapt to specific use cases. Configure these validation workflows to halt training automatically when performance degrades beyond acceptable thresholds.
Establish quality gates for model promotion between environments
Model quality assessment gates act as automated checkpoints that prevent poorly performing models from advancing through your deployment pipeline. Define specific criteria for each environment transition, such as minimum accuracy thresholds, bias detection scores, and performance benchmarks.
Build automated promotion workflows that evaluate models against these criteria before moving from development to staging, and staging to production. Use ML provenance tracking to maintain detailed records of which models passed specific quality gates and when. This creates an audit trail that helps teams understand why certain models were promoted or rejected.
| Environment | Quality Gate Criteria | Automated Actions |
|---|---|---|
| Development | Basic functionality tests | Log results, notify team |
| Staging | Performance benchmarks, bias checks | Block promotion if failed |
| Production | Full validation suite | Rollback capability |
Monitor production model performance and trigger retraining workflows
Production monitoring goes beyond basic uptime checks to include model drift detection, prediction quality assessment, and business metric tracking. Set up AWS machine learning monitoring services that continuously evaluate model outputs against expected distributions and performance baselines.
Configure automatic retraining triggers when performance metrics fall below defined thresholds or when data drift exceeds acceptable levels. SageMaker Lineage helps track these automated retraining cycles, maintaining visibility into when models were retrained and what data was used. This creates a complete ML workflow visibility that connects production performance issues directly to remediation actions.
Create feedback loops for iterative model improvement
Effective feedback loops capture production insights and channel them back into the development process. Design systems that collect user feedback, business outcomes, and model performance data, then automatically incorporate this information into future training cycles.
Use ML provenance tracking to connect production feedback with specific model versions and training datasets. This helps teams understand which training approaches produce models that perform well in real-world scenarios. Implement automated data labeling workflows that use production feedback to create new training examples, continuously improving your datasets.
Set up alerting systems for quality threshold violations
Smart alerting systems prevent alert fatigue while ensuring critical quality issues receive immediate attention. Configure multi-tier alerting that escalates based on severity and impact. Minor performance degradations might trigger email notifications, while significant quality drops could page on-call engineers.
Automated model evaluation systems should integrate with your existing monitoring infrastructure, sending alerts through established channels like Slack, PagerDuty, or email. Include contextual information in alerts, such as affected model versions, performance degradation percentages, and suggested remediation steps. This helps teams respond quickly and effectively to quality issues before they impact business outcomes.
Scaling ML Operations with Automated Provenance and Evaluation

Design reusable evaluation frameworks across multiple projects
Building evaluation frameworks that work across different projects saves countless hours and ensures consistent quality standards throughout your organization. Start by identifying common evaluation patterns across your ML use cases – whether you’re working with classification models, recommendation systems, or foundation models through Bedrock Model Evaluation.
Create modular evaluation components that can plug into any project. These components should include standardized metrics calculation, automated report generation, and configurable thresholds for different model types. Your framework needs template configurations for common scenarios like A/B testing, champion-challenger comparisons, and drift detection.
Consider packaging your evaluation logic into containerized services that teams can deploy independently. This approach lets different projects maintain their own evaluation schedules while benefiting from shared best practices. Include version control for your evaluation schemas so teams can track how assessment criteria evolve over time.
Store evaluation results in a centralized data store that supports both real-time queries and historical analysis. This setup enables cross-project insights and helps identify patterns that might not be visible within individual project silos.
Integrate lineage tracking with existing MLOps toolchains
SageMaker Lineage integration requires careful planning to mesh with your current MLOps infrastructure. Map out your existing tools – whether you’re using Jenkins, GitLab CI/CD, Kubeflow, or custom orchestration – and identify key integration points where lineage data should flow.
Set up automated lineage capture at critical pipeline stages. Your CI/CD systems should automatically register artifacts, experiments, and model versions with SageMaker Lineage APIs. This eliminates manual tracking overhead while ensuring no gaps in your provenance chain.
Create adapters for popular MLOps tools that don’t natively support SageMaker Lineage. These adapters should translate tool-specific metadata into lineage-compatible formats. For example, if you’re using MLflow for experiment tracking, build connectors that sync experiment data with SageMaker’s lineage system.
Configure your monitoring and alerting systems to consume lineage data for enhanced observability. When models behave unexpectedly in production, teams can quickly trace back through the lineage to identify root causes – whether they stem from data quality issues, feature engineering changes, or model architecture modifications.
Establish team collaboration workflows using shared tracking systems
Shared tracking systems break down silos between data science, engineering, and operations teams. Design role-based access controls that let different team members view relevant information while maintaining appropriate security boundaries. Data scientists need deep experiment visibility, while operations teams focus on production model health.
Implement notification systems that alert relevant stakeholders when important lineage events occur. When a model’s performance degrades, the system should notify both the original data scientist and the current operations team. Include context about recent changes that might have contributed to the issue.
Create dashboard templates tailored to different roles and use cases. Executive dashboards highlight high-level metrics and compliance status, while technical dashboards provide detailed lineage graphs and performance trends. Make these dashboards shareable and customizable so teams can adapt them to their specific needs.
Establish regular review cycles where teams examine lineage data together. These sessions help identify improvement opportunities and ensure everyone understands how their work impacts the broader ML lifecycle. Document decisions and insights from these reviews to build institutional knowledge about your ML operations patterns.
SageMaker Lineage and Bedrock Model Evaluation work together to create a robust foundation for machine learning operations that scales with your team’s needs. By tracking every piece of your ML workflow and continuously evaluating model quality, you’re building systems that are not just functional today, but resilient and trustworthy for the long haul. The combination of complete provenance tracking with automated quality assessment means you can catch issues early, understand exactly how your models were built, and make confident decisions about deploying changes.
The real power comes from treating these tools as part of your daily workflow rather than afterthoughts. Set up automated tracking from day one, establish clear evaluation benchmarks for your foundation models, and create processes that make provenance data easy for your team to access and understand. When you invest in proper ML governance now, you’re saving yourself from debugging nightmares and compliance headaches down the road. Start small with one project, get the tracking and evaluation pipelines working smoothly, then expand these practices across your entire ML ecosystem.