Data science teams using Databricks need structured approaches to maximize their notebook efficiency. This guide shares practical best practices for data scientists, ML engineers, and analytics professionals working in collaborative environments.
We’ll cover essential strategies for notebook organization and collaboration, including how to structure your code for better maintainability and set up environments that work seamlessly across team members. You’ll also learn performance optimization techniques that can dramatically speed up your data processing workflows.
By following these tested practices, your team will create more reliable, efficient, and secure notebook solutions while avoiding common pitfalls that slow down data science projects.
Understanding Databricks Notebook Architecture

A. Key components that power collaborative data science
Ever tried building a house with just a hammer? Pretty limiting, right? That’s how data science feels without the right tools. Databricks notebooks pack a serious punch with components specifically designed for team collaboration.
At their core, Databricks notebooks run on a distributed computing framework that handles everything from simple data processing to complex machine learning. The notebook interface itself combines code execution, visualization, and documentation in a single canvas.
The secret sauce? Revision history tracking that captures every change. No more “who broke the model?” debates. You can see exactly who did what and when.
Another game-changer is the built-in commenting system. Team members can leave notes directly on code blocks instead of flooding your Slack with questions.
Databricks also nails the language flexibility part. Your Python expert, R enthusiast, and SQL wizard can all work in the same notebook using their preferred languages. No translation needed.
B. How notebooks integrate with the Databricks ecosystem
Databricks notebooks aren’t lone wolves – they’re deeply connected to the entire platform ecosystem.
The integration with Delta Lake is seamless, giving you reliable data storage with ACID transactions. Need to version your datasets? It’s built right in.
Running a complex workflow? Notebooks slot directly into Databricks Jobs, letting you schedule and orchestrate multi-step processes without leaving the platform.
MLflow integration tracks your experiments automatically. Every model parameter, metric, and artifact gets logged without you writing a single line of extra code.
Unity Catalog gives your notebooks unified access control across all your data assets. No more permission headaches when sharing work.
And for those enterprise workloads, notebooks hook directly into cluster resources. Need to scale up for a big job? Just change your cluster config and keep working.
C. Comparing Databricks notebooks to alternative platforms
The notebook market is crowded, but Databricks stands out in several key areas.
| Feature | Databricks | Jupyter | Google Colab | Azure ML Notebooks |
|---|---|---|---|---|
| Compute | Native cluster integration | Separate kernel setup | Limited free resources | Azure-based compute |
| Collaboration | Real-time co-editing | Basic sharing | Google-style sharing | Team workspaces |
| Version Control | Built-in, enterprise-grade | Manual Git integration | Basic versioning | Azure DevOps integration |
| Enterprise Security | IAM, RBAC, audit logs | Limited | Google account-based | Azure security stack |
| Data Integration | Native to Delta Lake, Unity Catalog | Manual connectors | Google Drive focused | Azure storage focus |
Most alternatives make you choose between ease-of-use and enterprise features. Databricks doesn’t force that trade-off.
While Jupyter offers great flexibility, it requires significant DevOps effort to make it enterprise-ready. Colab is super accessible but hits walls with serious enterprise workloads.
The biggest difference? Databricks notebooks were built from day one for production data science, not just exploration.
Setting Up Optimal Notebook Environments

Configuring clusters for maximum performance
Ever tried running a complex model only to watch your cluster crawl along like a snail? Been there. The secret to blazing-fast Databricks notebooks starts with proper cluster configuration.
First off, pick the right instance types. For CPU-heavy tasks, go with compute-optimized instances. Running deep learning? GPU instances are your best friend.
Worker sizing matters too. Rather than one massive driver node with tiny workers, aim for balanced sizing. Your autoscaling settings should match your workload patterns – tight bounds for predictable jobs, wider ranges for variable workloads.
# Example cluster JSON configuration
{
  "spark_version": "10.4.x-scala2.12",
  "node_type_id": "Standard_F16s_v2",
  "driver_node_type_id": "Standard_F16s_v2",
  "autoscale": {
    "min_workers": 2,
    "max_workers": 8
  }
}
Managing dependencies efficiently
Nothing kills productivity faster than dependency hell. Trust me.
Databricks offers three main ways to handle libraries:
- Notebook-scoped libraries – Quick but not shareable
- Cluster-installed libraries – Team-wide consistency
- Init scripts – For complex environment setup
Most teams get this wrong. Don’t install everything on every cluster. Instead, create purpose-built clusters with just what you need.
# Add libraries directly in notebook (for quick tests only)
%pip install lightgbm==3.3.2

# Better approach: Define libraries in cluster UI or API
For Python-heavy teams, consider creating a custom container with your dependencies pre-installed. This slashes startup times and eliminates “works on my cluster” problems.
Version control best practices
Code without version control is like playing Russian roulette with your projects.
Databricks Repos lets you connect directly to Git. This isn’t just a nice-to-have – it’s essential.
Branch smartly:
main– production-ready code onlydev– integration testing- Feature branches – where the real work happens
Commit small, commit often. Those massive notebook changes with 50+ cells modified? Recipe for merge conflicts.
Pull requests should include notebook runs with outputs – this proves your changes actually work, not just look good.
# .gitignore for Databricks projects
*.pyc
.DS_Store
.idea/
.ipynb_checkpoints/
__pycache__/
Setting up reproducible environments
Reproducibility isn’t just academic jargon – it’s what separates professional data teams from amateurs.
Start with clear notebook parameters. Use widgets to make inputs explicit:
dbutils.widgets.text("data_date", "2023-01-01", "Data Date")
data_date = dbutils.widgets.get("data_date")
Pin your dependencies with exact versions. “Latest” is not your friend.
Document your data sources with lineage information. Where did this table come from? Who created it? When?
For critical workflows, save environment snapshots. Databricks Runtime versions change, and silent upgrades can break working code.
The ultimate reproducibility move? Containerization. Custom Docker images let you freeze your entire environment, guaranteeing consistent results across any cluster or team member.
Collaborative Workflow Strategies

Role-based Access Control for Team Efficiency
Gone are the days of the wild west approach to notebook access. Smart teams implement role-based controls that actually make sense for data science workflows.
Here’s what works:
- Admins: Full system configuration rights
- Project Leads: Workspace management and deployment capabilities
- Data Scientists: Read/write access to development areas
- Analysts: Read access to production notebooks with limited execution rights
The magic happens when you align these roles with your team structure. Don’t just copy IT security models – data science teams need flexibility without sacrificing governance.
Real-time Collaboration Techniques
Nothing kills productivity like waiting for someone to finish their work before you can start yours. Databricks’ real-time collaboration features are game-changers if you use them right.
Try these approaches:
- Split complex notebooks into functional chunks that different team members can work on simultaneously
- Use comments with @mentions to flag issues without interrupting workflow
- Schedule dedicated “collaboration hours” when everyone’s online for rapid iteration
- Leverage the “Follow” feature during pair programming sessions
Code Review Protocols for Data Science Teams
Code reviews for data science are different from software engineering. You’re checking both code quality AND analytical validity.
Effective Databricks notebook reviews should:
- Focus on reproducibility first
- Validate visualization outputs against expected patterns
- Check for appropriate documentation of assumptions
- Verify parameter handling for different scenarios
- Look for unnecessary computations that waste cluster resources
A structured review checklist tailored to your specific use cases saves enormous time.
Managing Notebook Sharing Across Departments
Cross-department sharing creates amazing opportunities and massive headaches. The difference? Thoughtful sharing protocols.
When sharing notebooks between teams:
- Create dedicated “interface” notebooks that abstract implementation details
- Document input/output expectations clearly
- Establish change management processes so updates don’t break downstream dependencies
- Use workspace folder structures that mirror organizational boundaries for clarity
Resolving Conflicts in Collaborative Environments
Conflicts happen. Good teams anticipate them rather than just reacting.
Databricks-specific conflict resolution strategies:
- Use Git integration for formal version control on production-critical notebooks
- Establish clear ownership boundaries within notebooks using commented sections
- Create sandbox environments for experimental work before merging to shared areas
- Document conflict resolution procedures in team wikis with specific Databricks examples
Teams that handle conflicts gracefully move faster because they’re not afraid to collaborate closely.
Code Organization and Modularity
Structuring Notebooks for Reusability
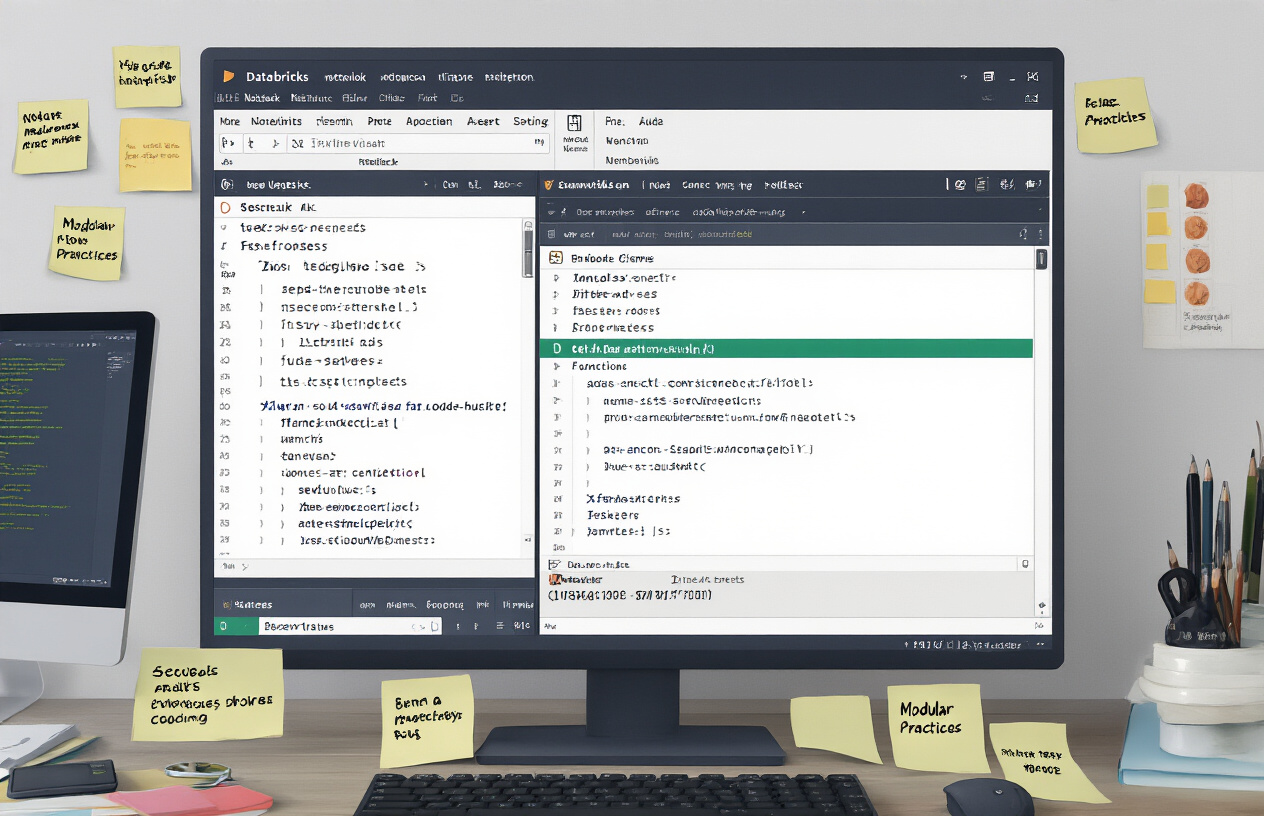
Messy notebooks kill productivity. I’ve seen data scientists waste hours searching through 2,000+ line notebooks trying to find that one transformation function they wrote last month.
Break your notebooks into logical chunks instead:
- Atomic notebooks: Create smaller, single-purpose notebooks that do one thing really well
- Workflow notebooks: These orchestrate your atomic notebooks using
%runcommands - Parameter notebooks: Define all configurable parameters in dedicated notebooks
Think of your notebooks like LEGO pieces. The best structures come from well-designed blocks that snap together effortlessly.
# Instead of this monolithic approach
def clean_data():
    # 200 lines of code

def feature_engineering():
    # 300 lines of code

# Split into separate notebooks you can call like this:
%run "./data_cleaning"
%run "./feature_engineering"
Creating Custom Libraries and Packages
The real magic happens when you graduate from notebooks to proper Python packages.
Here’s the brutal truth: if you’re copy-pasting code between notebooks, you’re doing it wrong.
Package your common functions:
- Create a Python wheel file with your team’s utilities
- Upload it to your Databricks workspace
- Install it in your cluster with
%pip install
Now everyone uses the same standardized functions rather than maintaining their own slightly different versions.
# Before: copy-paste hell
def calculate_metrics(df):
    # Same code duplicated in 12 different notebooks

# After: clean imports
from company_utils.metrics import calculate_metrics
Balancing Documentation and Code
Documentation shouldn’t be an afterthought. But let’s be real – nobody wants to read your 5-paragraph explanation of a simple data transformation.
Strike the right balance:
- Use markdown cells strategically – explain WHY, not just WHAT
- Add code comments for complex logic only
- Create standardized sections (Inputs, Process, Outputs)
- Include example outputs for visualization cells
The notebook below strikes the perfect balance:
# Input
[Markdown explaining data source]
[Code cell loading data]

# Transformation
[Markdown explaining business logic]
[Code cell with transformations]

# Output
[Markdown explaining what the visualization shows]
[Code cell with visualization]
Your notebooks should tell a story that both humans and machines can follow.
Performance Optimization Techniques

Memory management strategies
Databricks runs on Spark, and memory management can make or break your notebook performance.
The number one mistake I see? People treating Databricks like their local Python environment. It’s not.
When you’re handling large datasets, be mindful of your broadcast variables. If you’ve got a small lookup table (under 10MB), broadcasting it can slash join times:
small_df = spark.broadcast(small_df)
Cache smartly, don’t cache everything. That massive raw dataset? Probably don’t need it in memory after your initial transformation. But that cleaned, filtered dataset you keep referring to? Perfect candidate:
processed_df.cache().count() # The count() forces evaluation
Clear that memory when you’re done:
spark.catalog.clearCache()
Distributed computing best practices
Running into performance issues? You’re probably thinking about your data wrong.
Skewed data will destroy your performance. If 90% of your records have the same key, your poor executor handling that partition is going to be sweating while the others sit idle.
Use repartition() when you need even distribution, and partitionBy() when doing file operations:
# Even out data across 200 partitions
balanced_df = skewed_df.repartition(200)

# Smart partitioning when writing
df.write.partitionBy("date", "country").parquet("/path")
Avoid collect() unless absolutely necessary. You hired a distributed system – so why pull everything to the driver node?
Caching strategies for faster execution
Not all caching is created equal. Databricks gives you options:
| Cache Level | When to Use | Trade-off |
|---|---|---|
| MEMORY_ONLY | Fast access, sufficient RAM | Loses data if node fails |
| MEMORY_AND_DISK | Reliable, decent speed | Uses disk when needed |
| DISK_ONLY | Huge datasets, tight memory | Significantly slower |
The magic formula? Cache the “right-sized” datasets at transformation boundaries:
# This is the sweet spot after heavy filtering but before wide transformations
intermediate_df.persist(StorageLevel.MEMORY_AND_DISK)
Unpersist datasets when your workflow moves on:
intermediate_df.unpersist()
Monitoring and debugging performance issues
When your notebook crawls, you need visibility. The Spark UI is your best friend.
Navigate to the Spark UI directly from your cluster. Look for:
- Stage skew – one task taking 10x longer than others? Classic data skew.
- Spill metrics – if you see “spilled to disk,” your partitions are too big.
- Job lineage – complex chains of operations might need caching breakpoints.
Use explain to understand what’s happening under the hood:
df.explain(True) # Shows the full execution plan
Profile code sections to pinpoint bottlenecks:
with dbutils.profile():
    # Your potentially slow code here
    result = large_df.groupBy("category").agg(...)
Feeling really stuck? Try the trusty divide-and-conquer approach. Comment out half your transformations. Still slow? The problem’s in the remaining half. Rinse and repeat until you find the culprit.
Data Visualization and Reporting

Creating interactive dashboards within notebooks
Ever tried explaining complex data findings to someone who zones out when you mention the word “algorithm”? That’s where Databricks’ interactive dashboards save the day.
Right inside your notebook, you can build dashboards that turn cryptic numbers into stories. Start by using the displayHTML() function to create custom layouts, then leverage libraries like Plotly and Bokeh for interactive charts that respond when users hover or click.
# Simple interactive dashboard example
from pyspark.sql import functions as F
import plotly.express as px

# Create visualization
fig = px.scatter(df, x="feature_1", y="feature_2", color="category", size="importance")
displayHTML(fig.to_html())
The magic happens when you combine dbutils.widgets with your visualizations. Add dropdown menus, sliders, and text inputs so stakeholders can explore different scenarios without touching your code.
Pro tip: Use the %run command to pull visualizations from template notebooks into your dashboard. This keeps your dashboard code clean while letting you reuse visualization components across projects.
Embedding visualizations for stakeholder communication
Nothing kills a data presentation faster than flipping between tools. Databricks solves this by letting you embed visualizations directly where decisions happen.
Export your visualizations as HTML and embed them in:
- Confluence pages your team already uses
- Internal wikis where project documentation lives
- Email reports that executives actually read
- Microsoft Teams or Slack for quick insights
The best part? When you update your notebook, you can refresh these embedded visualizations with a simple script:
# Auto-publish visualization to shared location
html_content = fig.to_html()
dbutils.fs.put("/shared/dashboards/project_viz.html", html_content, overwrite=True)
Make your visualizations tell stories by:
- Highlighting the most important insights first
- Adding context with markdown text around charts
- Using consistent color schemes that align with what the numbers mean
- Including interactive filters that answer stakeholders’ follow-up questions before they ask
Designing reproducible reports
Data science reports that can’t be reproduced might as well be fiction. Here’s how to make sure your Databricks reports stand up to scrutiny.
First, set parameters at the top of your notebook with clear defaults:
# Parameters
dbutils.widgets.text("date_range", "30", "Time period (days)")
date_filter = int(dbutils.widgets.get("date_range"))
Then structure your notebook with separate cells for:
- Data acquisition
- Processing
- Analysis
- Visualization
Document each step with markdown cells explaining not just what you did, but why you did it. Future-you will thank present-you when revisiting this six months later.
For truly reproducible reports, version your data alongside your code. Store snapshots in Delta tables with time travel capabilities:
# Save dataset version for reproducibility
snapshot_date = datetime.now().strftime("%Y%m%d")
df.write.format("delta").mode("overwrite").save(f"/data/snapshots/{snapshot_date}/project_data")
Combine this with notebook scheduling, and you’ve got reports that automatically update while maintaining perfect reproducibility.
Automating Notebook Workflows
Scheduling notebook jobs effectively
Nobody wants to manually run the same notebook over and over. That’s just mind-numbing busywork.
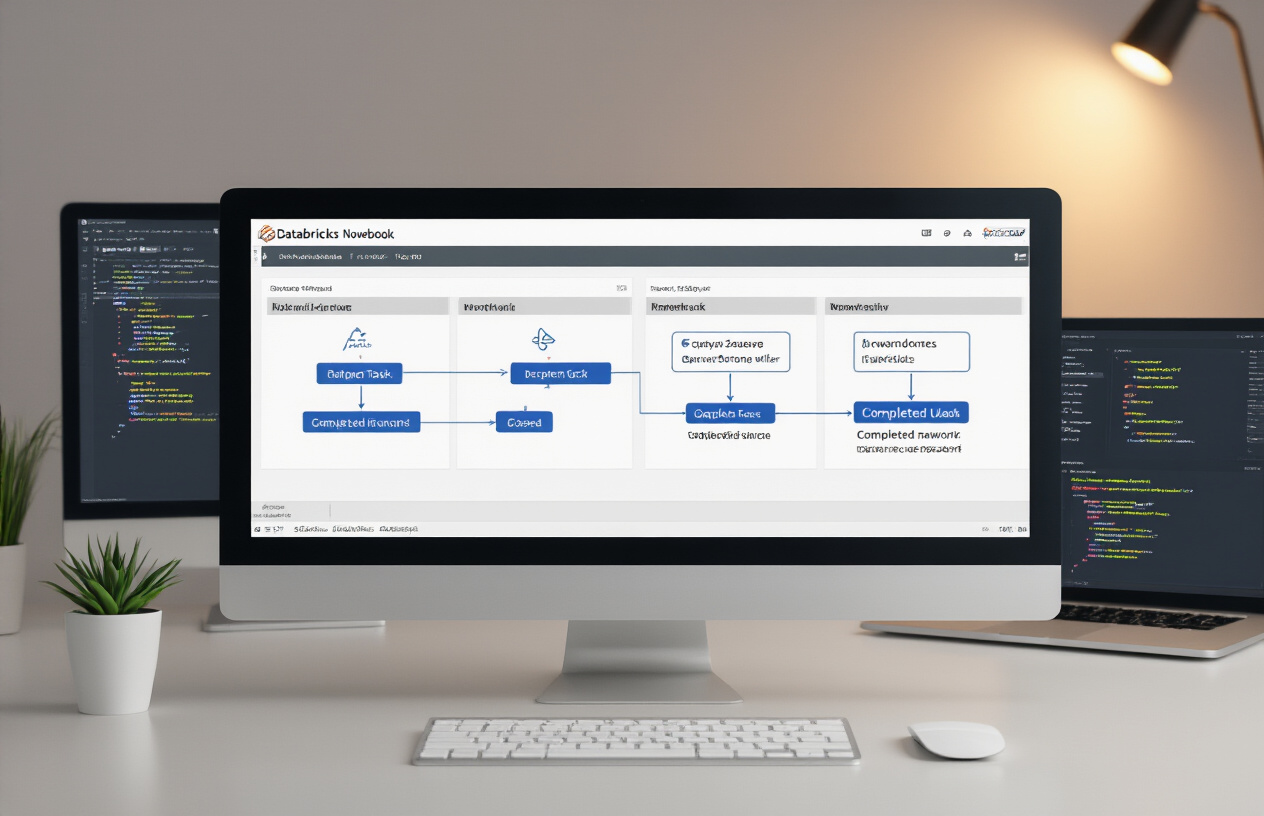
Databricks Job Scheduler is your friend here. You can set up your notebooks to run hourly, daily, weekly, or on custom cron schedules. The real magic happens when you:
- Group related notebooks into a single job with dependencies
- Set different timeout values for notebooks that might take longer
- Use parameters to make your scheduled notebooks flexible
Pro tip: Don’t schedule everything to run at midnight. Spread your jobs throughout off-hours to avoid resource contention. Your cluster won’t choke, and your finance team won’t freak out about sudden compute spikes.
Creating notebook pipelines
Single notebooks are fine for exploration, but production work demands pipelines.
With Databricks Workflows, you can chain notebooks together with minimal effort:
dbutils.notebook.run("./data_ingestion", 600, {"date": "2023-01-01"})
dbutils.notebook.run("./data_processing", 1200)
dbutils.notebook.run("./reporting", 300)
The beauty of this approach? Each notebook has a specific job to do. When something breaks (and something always breaks), you’ll know exactly where to look.
For complex pipelines, use Databricks Workflows UI to create DAGs with branching logic and parallel execution. Your data engineers will thank you.
Implementing CI/CD for notebook development
Treating notebooks like wild west code is a recipe for disaster.
Set up a proper CI/CD pipeline by:
- Storing notebooks in Git (Azure DevOps, GitHub, etc.)
- Creating development, staging, and production workspaces
- Using the Databricks CLI for automated deployments
- Running integration tests before promoting to production
Databricks Repos makes this way easier by connecting directly to your Git provider. No more copy-pasting code between environments!
The real game-changer? Parameterize everything in your notebooks. This way, the same code works across all environments:
env = dbutils.widgets.get("environment")
if env == "prod":
    data_path = "/production/data"
else:
    data_path = "/dev/data"
Error handling and notification systems
Silent failures are the worst. Nobody knows something’s broken until the CEO can’t see their dashboard.
Build robust error handling into your notebooks:
try:
    # Your important code here
except Exception as e:
    # Log the error
    error_message = f"Pipeline failed: {str(e)}"
    log_error(error_message)

    # Send notifications
    send_slack_alert(error_message)
    send_email_alert("team@company.com", error_message)

    # Fail explicitly
    raise e
For critical pipelines, implement dead man’s switch monitoring. If a notebook doesn’t complete by a certain time, trigger alerts automatically.
And please, customize your error messages. “Error: null value” helps nobody. “Customer dimension table failed to update due to missing data from CRM API” tells your team exactly what needs fixing.
Enterprise-Grade Security Practices

Implementing data access controls
Data security isn’t just nice-to-have in Databricks—it’s mission-critical.
When your team is knee-deep in sensitive data, you need robust access controls that actually work. Start with Databricks’ Table Access Control (TAC) feature, which lets you set permissions at the database, table, and column levels. This granularity means your marketing team sees only what they should, while your data scientists get the full picture.
# Example: Granting read access to a specific group
spark.sql("GRANT SELECT ON TABLE customer_data TO GROUP 'marketing_analysts'")
Don’t sleep on Workspace access controls either. Create separate folders for different teams and projects, then lock them down with appropriate permissions. This keeps your experimental notebooks from accidentally becoming production disasters.
Managing secrets and credentials
Hard-coding AWS keys in notebooks? Stop that right now.
Databricks Secret Management exists for exactly this reason. It integrates with your existing secret stores (Azure Key Vault, AWS Secrets Manager) and makes credentials available to your code without exposing them.
# Instead of this:
# aws_access_key = "AKIAIOSFODNN7EXAMPLE"  # DANGER!

# Do this:
aws_access_key = dbutils.secrets.get(scope="aws", key="access_key")
Pro tip: Create different secret scopes for different environments. Your dev environment should never use production credentials, period.
Audit logging and compliance considerations
Your security team will thank you for Databricks’ comprehensive audit logs. Every notebook execution, every cluster creation, every SQL query—all tracked.
These logs aren’t just for troubleshooting. They’re your best friend during compliance audits. GDPR, HIPAA, SOC 2—whatever regulatory alphabet soup you’re swimming in, these logs help demonstrate who accessed what and when.
Configure log retention periods based on your industry requirements. Healthcare? You might need years of history. Marketing analytics? Maybe less.
Don’t forget to set up automated reporting on these logs. A weekly security digest highlighting unusual access patterns can catch problems before they explode into full-blown breaches.

Mastering Databricks Notebooks empowers data science teams to work more efficiently and collaboratively. From understanding the architecture to implementing optimal environments, organizing code effectively, and automating workflows, these best practices serve as the foundation for successful data science projects. The performance optimization techniques and data visualization capabilities further enhance your team’s ability to derive meaningful insights from complex data.
As you implement these practices within your organization, remember that security remains paramount. By adopting enterprise-grade security measures alongside collaborative workflows, your team can innovate faster while maintaining data governance standards. Start by incorporating one best practice at a time, measure the impact, and gradually transform how your data science team leverages the full potential of Databricks Notebooks.


