


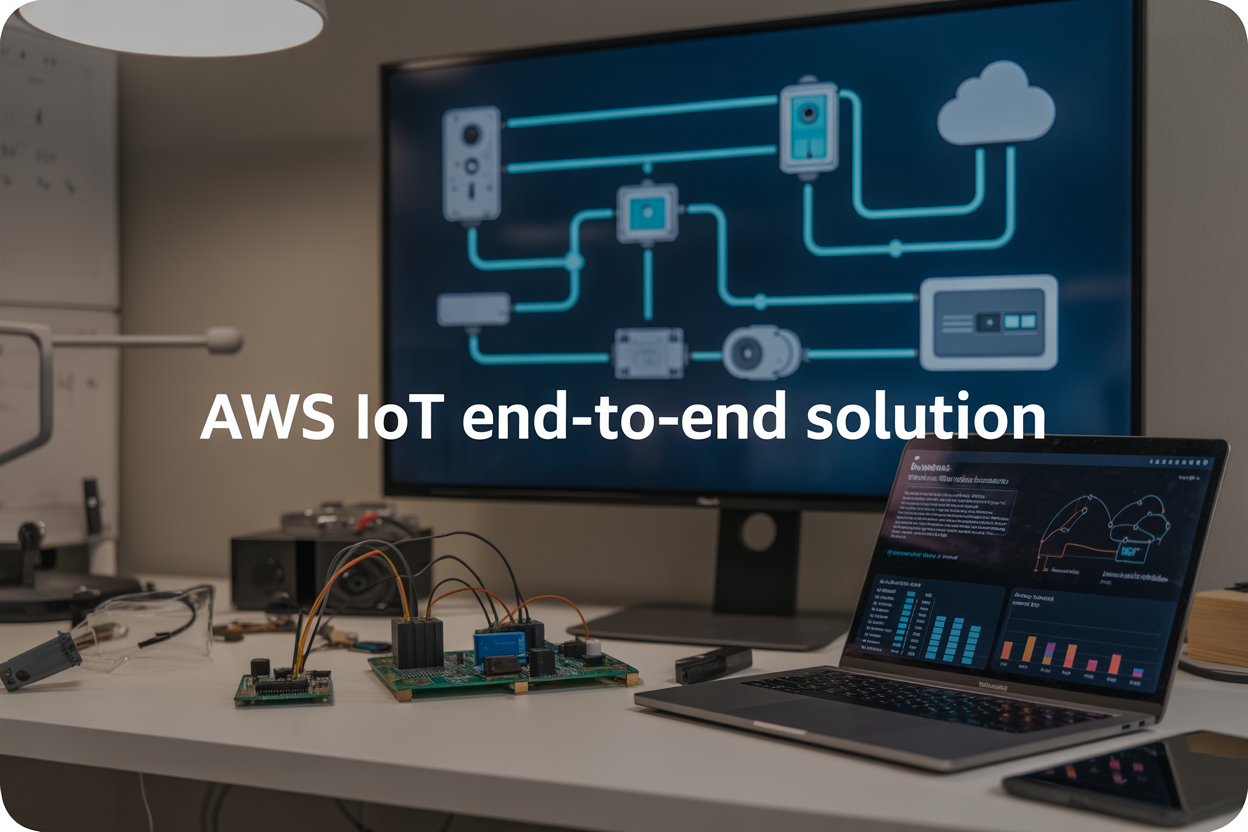
Building a complete AWS IoT solution can feel overwhelming when you’re staring at dozens of AWS services and trying to figure out how they all connect. This guide breaks down the entire process into manageable steps, showing you exactly how to create an end-to-end IoT architecture that works reliably in production.
This walkthrough is designed for developers, IoT engineers, and technical teams who want to build scalable IoT systems using AWS services. You might be working on your first IoT project or looking to migrate existing solutions to a more robust cloud platform.
We’ll start by getting your IoT hardware talking to AWS IoT Core, covering everything from device certificates to secure IoT communication protocols. Then we’ll dive into building data processing pipelines using the AWS IoT rules engine to transform and route your sensor data automatically. Finally, you’ll learn how to set up real-time IoT analytics and create monitoring dashboards that give you instant visibility into your IoT device integration AWS setup.
By the end, you’ll have a complete IoT data processing pipeline running on AWS that can handle everything from a few test devices to thousands of sensors sending data 24/7.
Setting Up Your IoT Hardware for AWS Integration
Selecting Compatible IoT Devices and Sensors
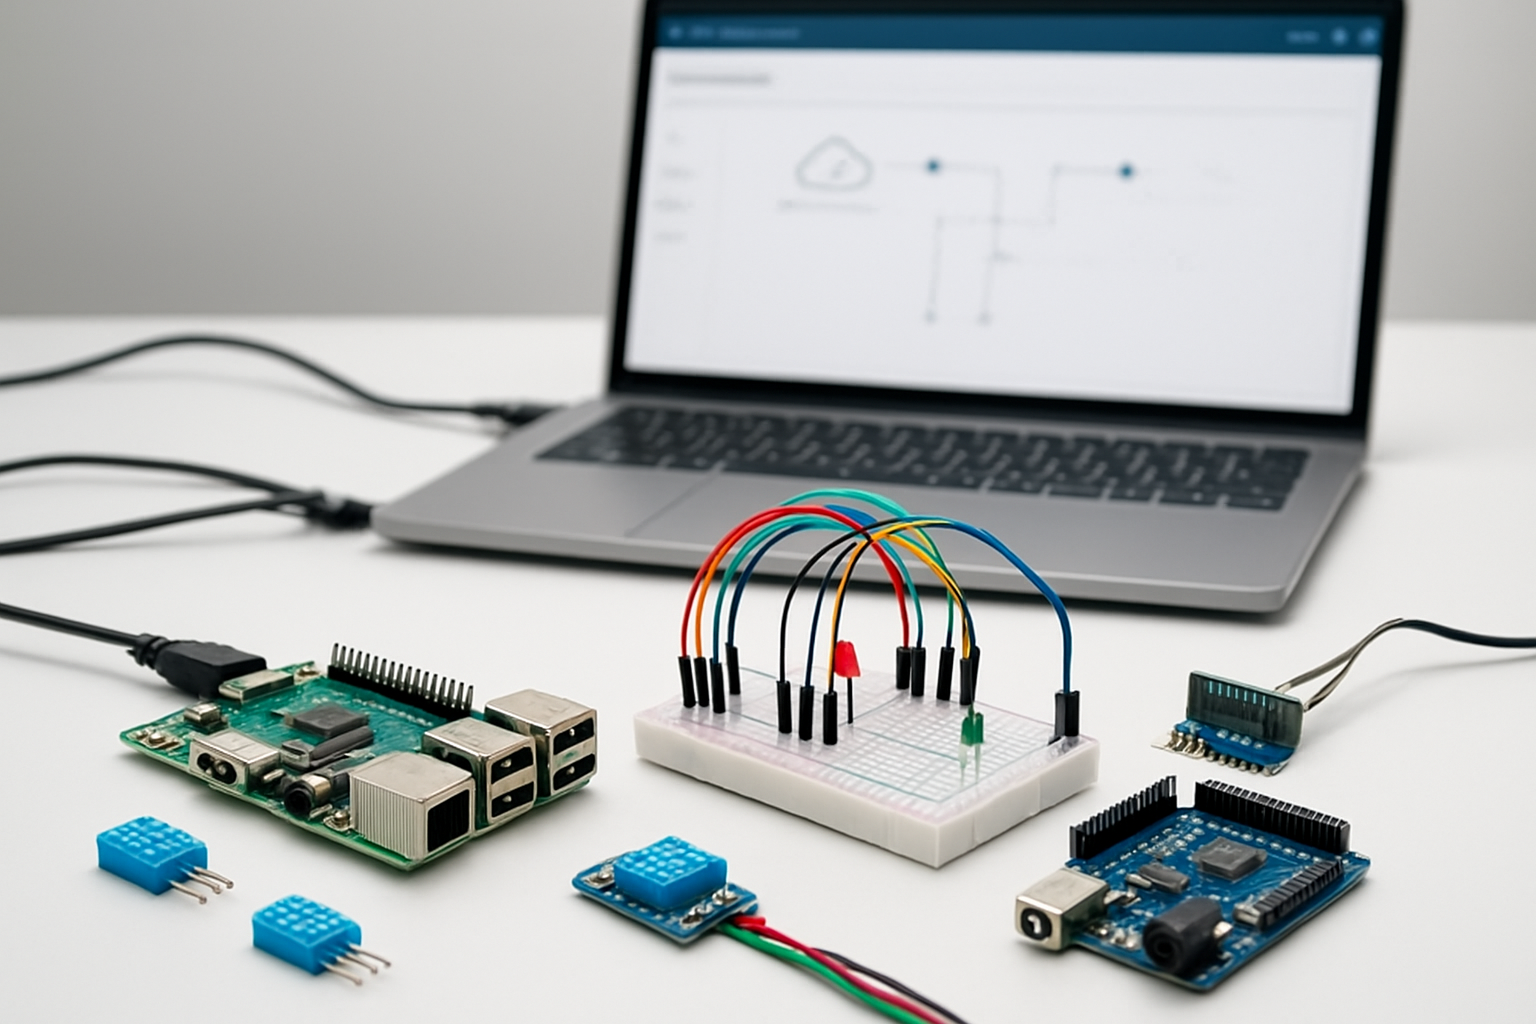
Choosing the right hardware forms the foundation of your AWS IoT solution. Popular single-board computers like Raspberry Pi 4, Arduino MKR WiFi 1010, and ESP32 development boards offer excellent compatibility with AWS IoT Core. These devices provide built-in connectivity options and sufficient processing power to handle IoT workloads.
When selecting sensors, consider your specific use case requirements. Temperature and humidity sensors (DHT22, SHT30), motion detectors (PIR sensors), and environmental monitors (air quality sensors) integrate seamlessly with AWS services. Industrial applications benefit from robust sensors like pressure transducers, vibration monitors, and current transformers that can withstand harsh conditions.
Key compatibility factors include:
- Connectivity options: WiFi, Ethernet, cellular (LTE-M, NB-IoT)
- Processing capability: Adequate RAM and storage for AWS SDK operations
- Power consumption: Battery life considerations for remote deployments
- Operating system support: Linux-based systems work best with AWS IoT Device SDK
Installing Required Libraries and SDKs
The AWS IoT Device SDK provides the essential tools for connecting your hardware to AWS IoT Core. Different programming languages require specific SDK installations:
Python SDK Installation:
pip install AWSIoTPythonSDK
pip install boto3
C++ SDK for embedded systems:
git clone https://github.com/aws/aws-iot-device-sdk-cpp-v2.git
cmake -DCMAKE_BUILD_TYPE=Release
make install
JavaScript/Node.js SDK:
npm install aws-iot-device-sdk
npm install aws-sdk
Additional dependencies often include JSON parsing libraries, cryptographic modules for certificate handling, and networking libraries. Embedded systems may require specific toolchains like PlatformIO for Arduino-based devices or cross-compilation tools for ARM processors.
Configuring Device Certificates and Security Keys
Security certificates authenticate your devices with AWS IoT Core using X.509 certificates. Each device requires a unique certificate-key pair to establish secure communication channels.
Certificate Generation Process:
-
Create device certificates in AWS IoT Console:
- Navigate to IoT Core → Secure → Certificates
- Choose “Create certificate” → “Auto-generate a new certificate”
- Download certificate files: device certificate, private key, and root CA
-
Store certificates securely on device:
/home/pi/aws-iot/ ├── certificate.pem.crt ├── private.pem.key └── AmazonRootCA1.pem -
Set appropriate file permissions:
chmod 644 certificate.pem.crt
chmod 600 private.pem.key
chmod 644 AmazonRootCA1.pem
Certificate Policy Configuration:
Create an IoT policy that defines device permissions:
{
  "Version": "2012-10-17",
  "Statement": [{
    "Effect": "Allow",
    "Action": "iot:*",
    "Resource": "arn:aws:iot:region:account:topic/device/+/data"
  }]
}
Establishing Initial Device Connectivity
Testing connectivity ensures your device can communicate with AWS IoT Core before deploying complex functionality. Start with a simple connection test using the MQTT protocol.
Basic Connection Test (Python):
from AWSIoTPythonSDK.MQTTLib import AWSIoTMQTTClient

# Initialize MQTT client
myMQTTClient = AWSIoTMQTTClient("myDeviceID")
myMQTTClient.configureEndpoint("your-endpoint.iot.region.amazonaws.com", 8883)
myMQTTClient.configureCredentials("AmazonRootCA1.pem", "private.pem.key", "certificate.pem.crt")

# Connect and verify
if myMQTTClient.connect():
    print("Connected to AWS IoT Core successfully!")
else:
    print("Connection failed - check certificates and network")
Connection Parameters:
- MQTT port 8883: Secure connection using TLS
- Keep-alive interval: Set to 30-600 seconds based on application needs
- Client ID: Must be unique across all connected devices
- Clean session: Set to True for most applications
Troubleshooting Common Issues:
- Verify endpoint URL matches your AWS region
- Check certificate file paths and permissions
- Confirm device has internet connectivity
- Validate certificate is active in AWS IoT Console
- Monitor AWS IoT Core logs for connection attempts
Network connectivity tests should include ping tests to AWS endpoints and DNS resolution verification. Firewall configurations must allow outbound connections on port 8883 for MQTT over TLS.
Configuring AWS IoT Core for Device Management

Creating IoT Things and Device Shadows
Getting your devices registered in AWS IoT Core starts with creating IoT Things – digital representations of your physical devices. Think of an IoT Thing as your device’s passport in the AWS ecosystem. Each Thing gets a unique identity and holds metadata about your device, like its model, firmware version, and location.
Device Shadows are where the real magic happens. These JSON documents store your device’s current and desired states, creating a virtual twin in the cloud. When your sensor goes offline, the Device Shadow keeps track of its last known state. When it comes back online, it syncs up with any changes that happened while it was away.
Here’s how you create an IoT Thing:
aws iot create-thing --thing-name "temperature-sensor-001" --thing-type-name "TemperatureSensor"
The Device Shadow service automatically creates a shadow for each Thing. You can update the shadow with desired states:
{
  "state": {
    "desired": {
      "temperature": 22,
      "humidity": 45,
      "reporting_interval": 60
    }
  }
}
Setting Up MQTT Topics and Message Routing
MQTT topics form the communication backbone of your AWS IoT solution. These hierarchical channels determine where messages go and who receives them. Smart topic design makes your IoT architecture scalable and maintainable.
AWS IoT Core uses a pub/sub model where devices publish messages to topics and subscribe to receive updates. Your topic structure should reflect your device hierarchy and data types:
devices/sensors/temperature/data– for temperature readingsdevices/actuators/hvac/commands– for HVAC controldevices/gateways/building-a/status– for gateway health
Reserved topics start with $aws/ and handle special functions:
$aws/things/{thingName}/shadow/update– updates Device Shadow$aws/things/{thingName}/shadow/get– retrieves shadow state$aws/events/presence/connected/{clientId}– device connection events
Message routing happens through topic filters that support wildcards:
+matches single level:devices/+/temperaturematches any device type#matches multiple levels:devices/sensors/#matches all sensor subtopics
Implementing Device Authentication Policies
Security sits at the heart of any production IoT deployment. AWS IoT Core uses X.509 certificates for device authentication, paired with IAM-style policies that control what each device can do.
Start by creating a certificate for each device:
aws iot create-keys-and-certificate --set-as-active --certificate-pem-outfile cert.pem --private-key-outfile private.key --public-key-outfile public.key
IoT policies define permissions using familiar Allow/Deny statements. A typical sensor policy might look like:
{
  "Version": "2012-10-17",
  "Statement": [
    {
      "Effect": "Allow",
      "Action": [
        "iot:Publish"
      ],
      "Resource": [
        "arn:aws:iot:us-west-2:123456789012:topic/devices/sensors/${iot:ClientId}/data"
      ]
    },
    {
      "Effect": "Allow",
      "Action": [
        "iot:Subscribe",
        "iot:Receive"
      ],
      "Resource": [
        "arn:aws:iot:us-west-2:123456789012:topic/devices/sensors/${iot:ClientId}/commands"
      ]
    }
  ]
}
The ${iot:ClientId} variable ensures devices can only access their own topics. This prevents one compromised device from affecting others.
Policy variables add flexibility:
${iot:Connection.Thing.ThingName}– restricts access to the device’s Thing name${iot:Connection.Thing.Attributes[attribute-name]}– uses Thing attributes in policies${iot:Connection.Thing.ThingTypeName}– groups devices by type
Always follow the principle of least privilege – give devices only the permissions they absolutely need.
Establishing Secure Device-to-Cloud Communication

Configuring SSL/TLS Encryption Protocols
Setting up proper encryption for your AWS IoT solution starts with configuring SSL/TLS protocols to protect data in transit. AWS IoT Core automatically enforces TLS 1.2 encryption for all device connections, creating a secure tunnel between your IoT devices and the cloud. Your devices need X.509 certificates for mutual authentication – this means both the device and AWS verify each other’s identity before establishing communication.
The certificate setup process involves generating a public-private key pair and either having AWS IoT create the certificate or uploading your own. Each device gets a unique certificate that AWS IoT Core validates during connection attempts. Store the private key securely on your device, preferably in hardware security modules when available.
Configure your device’s MQTT client to use port 8883 for secure connections. The AWS IoT Device SDK handles most of the heavy lifting, but you’ll need to specify the certificate paths and enable certificate verification. For production deployments, implement certificate rotation policies to maintain security over time.
Setting Up Message Queuing and Delivery Guarantees
MQTT provides three Quality of Service (QoS) levels that determine message delivery guarantees in your secure IoT communication setup. QoS 0 delivers messages at most once with no acknowledgment – perfect for sensor readings where occasional data loss is acceptable. QoS 1 guarantees at-least-once delivery through acknowledgments, ideal for important device status updates. QoS 2 ensures exactly-once delivery but comes with higher overhead.
AWS IoT Core supports QoS 0 and QoS 1 for device-to-cloud communication. Choose QoS 1 for critical telemetry data and device lifecycle events. The service automatically handles message queuing when devices are offline, storing messages for up to one hour by default.
Configure persistent sessions by setting the MQTT clean session flag to false. This allows AWS IoT to maintain message queues and subscriptions when devices temporarily disconnect. Size your message queues appropriately – AWS IoT limits the number of queued messages per device to prevent resource exhaustion.
Implementing Error Handling and Retry Mechanisms
Robust error handling prevents communication failures from disrupting your AWS IoT solution. Implement exponential backoff for connection retries, starting with a 1-second delay and doubling it with each failed attempt up to a maximum interval. This approach prevents overwhelming the service during outages while ensuring eventual reconnection.
Your devices should handle different types of connection failures distinctly. Network timeouts require immediate retry attempts, while authentication failures need certificate validation before reconnecting. Track connection state and implement circuit breakers that temporarily stop retry attempts after consecutive failures to conserve battery and bandwidth.
Build message-level error handling for publish operations. MQTT QoS 1 provides automatic retries for unacknowledged messages, but your application should track important messages and implement custom retry logic with unique message identifiers. Store failed messages locally when possible and retransmit them once connectivity resumes.
Monitor error patterns through AWS IoT device metrics and CloudWatch logs. Set up alerts for high error rates or authentication failures that might indicate security issues or device malfunctions.
Testing Bidirectional Communication Flows
Validate your secure IoT communication by testing both device-to-cloud and cloud-to-device message flows. Start with simple ping-pong tests where devices publish status messages and acknowledge cloud commands. Use AWS IoT Test Client to send messages manually and verify device responses.
Test various network conditions including poor connectivity, intermittent failures, and complete disconnections. Simulate these scenarios using network emulation tools or by controlling your device’s network interface. Verify that your retry mechanisms work correctly and messages aren’t lost during reconnection cycles.
Implement automated test suites that continuously validate communication flows. Create test scenarios for certificate expiration, invalid credentials, and malformed messages. Use AWS IoT device simulation tools to test at scale before deploying to production environments.
Measure key performance metrics including message latency, connection establishment time, and throughput under different loads. Document baseline performance characteristics and set up monitoring to detect degradation over time. Test with multiple devices simultaneously to identify potential bottlenecks in your AWS IoT Core configuration.
Building Data Processing Pipelines with AWS IoT Rules

Creating Rules Engine for Message Routing
The AWS IoT rules engine serves as the central nervous system of your IoT data processing pipeline, automatically routing messages from connected devices to appropriate AWS services. When devices publish messages to AWS IoT Core, the rules engine evaluates each message against predefined SQL-like queries to determine the next destination.
Setting up rules involves writing SQL statements that select specific fields from incoming JSON messages. For example, a temperature sensor might publish data like , "humidity": 60, "deviceId": "sensor01"}, and your rule can extract just the temperature reading using SELECT temperature FROM 'topic/temperature'.
The beauty of the rules engine lies in its ability to route the same message to multiple destinations simultaneously. You can send temperature readings to Amazon DynamoDB for historical storage, trigger Lambda functions for immediate processing, and forward critical alerts to Amazon SNS for notifications. This parallel processing capability makes your AWS IoT solution highly efficient and responsive.
Rules support various actions including writing to databases, invoking functions, publishing to other topics, and even republishing transformed data back to IoT Core. The engine processes millions of messages without requiring you to manage any infrastructure, scaling automatically based on your device traffic patterns.
Transforming Raw Sensor Data into Structured Formats
Raw sensor data often arrives in formats that aren’t immediately useful for analysis or storage. The AWS IoT rules engine includes powerful transformation capabilities that convert unstructured or poorly formatted data into clean, standardized formats your applications can easily consume.
Using SQL functions within rules, you can perform mathematical calculations, string manipulations, and data type conversions. For instance, if your temperature sensors report Celsius but your analytics dashboard expects Fahrenheit, you can transform the data using SELECT (temperature * 9/5) + 32 as temp_fahrenheit FROM 'topic/sensors'.
The transformation engine supports functions for:
- Mathematical operations: Addition, subtraction, multiplication, division
- String functions: Concatenation, substring extraction, case conversion
- Date/time functions: Timestamp formatting, timezone conversions
- Conditional logic: CASE statements for complex data routing decisions
You can also enrich incoming messages by adding metadata like timestamps, device locations, or computed values. This enrichment happens in real-time as messages flow through the system, ensuring downstream services receive fully prepared data without additional processing overhead.
Complex transformations might involve combining multiple sensor readings into composite metrics or normalizing data from different device types into a unified schema. The rules engine handles these operations efficiently, maintaining high throughput even with sophisticated data transformations.
Filtering and Validating Incoming Device Messages
Not every message from IoT devices deserves the same processing attention. Filtering capabilities in AWS IoT rules help you focus computational resources on meaningful data while discarding noise, duplicate readings, or messages that don’t meet quality thresholds.
Basic filtering uses WHERE clauses in your SQL statements to evaluate message content. You might filter temperature readings to process only values above a certain threshold: SELECT * FROM 'topic/temperature' WHERE temperature > 30. This approach prevents unnecessary database writes and reduces downstream processing costs.
Message validation goes beyond simple filtering by checking data integrity and completeness. You can verify that required fields exist, validate data types, and ensure values fall within expected ranges. For example, a humidity sensor should never report values below 0% or above 100%, so your validation rule might include WHERE humidity >= 0 AND humidity <= 100.
Advanced filtering techniques include:
- Temporal filtering: Processing messages only during specific time windows
- Rate limiting: Accepting messages from devices at controlled intervals
- Duplicate detection: Comparing message content or timestamps to prevent duplicate processing
- Device-specific rules: Different validation criteria based on device type or location
Validation failures don’t have to result in lost data. You can route invalid messages to separate processing paths for logging, alerting, or manual review, creating a comprehensive data quality management system.
Implementing Real-time Data Enrichment
Data enrichment transforms basic sensor readings into contextually rich information by adding external data sources, computed metrics, or historical context. The AWS IoT rules engine enables real-time enrichment as messages flow through your system, eliminating the need for batch processing delays.
Static enrichment adds predetermined values based on device characteristics. When a message arrives from a specific device, your rule can append location information, device specifications, or operational parameters stored in device metadata. This contextual information proves invaluable for analytics and troubleshooting.
Dynamic enrichment involves real-time lookups or calculations. You might enrich weather sensor data by adding regional averages, calculate device efficiency metrics by comparing current readings to historical baselines, or append alert levels based on predefined thresholds. Lambda functions integrated with IoT rules can perform complex enrichment operations, including database lookups or API calls to external services.
Geographic enrichment adds particular value for distributed IoT deployments. By appending location data, timezone information, or regional characteristics to device messages, you enable location-aware analytics and region-specific processing rules.
The enrichment process must balance information value against processing latency. Critical data paths should prioritize speed over enrichment depth, while analytical workloads can benefit from comprehensive data augmentation.
Setting Up Dead Letter Queues for Failed Messages
Even well-designed IoT data processing pipelines encounter failures due to network issues, service unavailability, or malformed data. Dead letter queues (DLQs) provide a safety net by capturing messages that fail processing, preventing data loss and enabling systematic failure analysis.
AWS IoT rules support error actions that automatically route failed messages to designated destinations. When a primary action fails – perhaps a database write times out or a Lambda function encounters an error – the error action triggers, sending the message to an Amazon SQS dead letter queue for later processing.
Configuring DLQs involves setting up error actions alongside your primary rule actions. For each action that might fail, specify a corresponding error action pointing to your DLQ. This redundancy ensures that even if your primary data pipeline experiences issues, you maintain a complete record of all incoming device data.
DLQ monitoring helps identify systemic issues in your IoT solution. Patterns in failed messages might reveal network connectivity problems, capacity constraints, or data format changes that need attention. CloudWatch metrics and alarms can notify you when DLQ message volumes exceed normal thresholds.
Recovery processes should regularly drain DLQs, attempting to reprocess failed messages once underlying issues are resolved. Lambda functions or batch jobs can poll DLQs, validate message contents, and resubmit valid data to your primary processing pipeline, ensuring eventual consistency across your IoT data architecture.
Storing and Managing IoT Data at Scale

Configuring Amazon S3 for Long-term Data Storage
Amazon S3 serves as the backbone for long-term IoT data storage in your AWS IoT solution. When dealing with massive volumes of sensor data, telemetry readings, and device logs, S3 provides virtually unlimited storage capacity with multiple storage classes to optimize costs.
Start by creating dedicated S3 buckets for different data types. Organize your bucket structure logically – separate raw sensor data from processed analytics, and consider partitioning by device type, location, or time periods. For example, create paths like iot-raw-data/year=2024/month=01/day=15/ to enable efficient querying later.
Configure S3 storage classes strategically. Use Standard storage for frequently accessed recent data, transition to Infrequent Access (IA) after 30 days, and move to Glacier or Deep Archive for long-term retention. This approach can reduce storage costs by up to 80% compared to keeping all data in Standard storage.
Enable S3 versioning and cross-region replication for critical IoT data. Set up bucket notifications to trigger downstream processing when new data arrives. Configure server-side encryption using AWS KMS keys to protect sensitive IoT information at rest.
Setting Up DynamoDB for Real-time Device State Management
DynamoDB excels at managing real-time device state information and metadata in your AWS IoT Core setup. Unlike S3’s batch-oriented approach, DynamoDB provides millisecond response times for device status queries and state updates.
Design your DynamoDB table schema with device ID as the partition key. Include attributes for last seen timestamp, current status, firmware version, location, and configuration settings. Consider using composite keys when you need to track historical state changes or multiple device attributes.
Configure DynamoDB Auto Scaling to handle varying IoT workloads automatically. Set up read and write capacity units based on your expected device communication patterns. For applications requiring consistent performance, consider using provisioned capacity with reserved capacity pricing.
Implement Global Secondary Indexes (GSI) for common query patterns. Create indexes for querying devices by status, location, or device type. This enables efficient dashboard queries without scanning the entire table.
| DynamoDB Feature | IoT Use Case | Benefit |
|---|---|---|
| Point-in-time recovery | Device state rollback | Data protection |
| DynamoDB Streams | Real-time notifications | Event-driven processing |
| Global Tables | Multi-region deployments | Low latency access |
Use DynamoDB Streams to trigger AWS Lambda functions when device states change, enabling real-time alerts and automated responses.
Implementing Data Lifecycle Policies and Archiving
Smart data lifecycle management keeps your IoT cloud architecture cost-effective while maintaining data accessibility. Create automated policies that move data through different storage tiers based on age, access patterns, and business requirements.
Set up S3 Lifecycle policies to automatically transition IoT data. Configure rules that move objects from Standard to IA after 30 days, then to Glacier after 90 days, and finally to Deep Archive after one year. Customize these timeframes based on your specific compliance and analytics needs.
For DynamoDB, implement Time-to-Live (TTL) settings to automatically expire old device state records. This prevents table bloat and reduces storage costs. Archive expired records to S3 before deletion if needed for historical analysis.
Create data archiving workflows using AWS Step Functions to orchestrate complex lifecycle operations. These workflows can compress data, update metadata, and trigger cleanup processes across multiple services.
Establish data retention policies that align with regulatory requirements. Many IoT applications must retain data for specific periods – healthcare devices might need 7-year retention, while industrial sensors may only require 2 years. Document these policies and implement automated enforcement through lifecycle rules.
Monitor storage costs using AWS Cost Explorer and set up CloudWatch alarms for unexpected storage growth. Regular cost reviews help identify optimization opportunities and prevent budget surprises as your IoT data processing pipeline scales.
Creating Real-time Analytics and Monitoring Dashboards

Building Custom Visualizations with Amazon QuickSight
Amazon QuickSight transforms raw IoT data into meaningful business insights through interactive visualizations. Connect your IoT data sources directly to QuickSight by setting up data connections to Amazon S3 buckets, RDS databases, or Athena query results. This AWS IoT dashboard solution offers built-in machine learning capabilities that automatically detect anomalies and forecast trends in your device telemetry.
Create compelling visualizations by selecting appropriate chart types for different IoT metrics. Line charts work perfectly for time-series data like temperature readings, while heat maps excel at showing device performance across geographical locations. Bar charts help compare device performance metrics, and scatter plots reveal correlations between different sensor readings.
QuickSight’s SPICE engine accelerates query performance by storing frequently accessed data in memory. Configure automatic data refreshes to ensure your real-time IoT analytics dashboards display current information. Set up scheduled refreshes during off-peak hours to minimize impact on operational systems.
Share dashboards across teams using QuickSight’s collaboration features. Create different permission levels for stakeholders – executives might need high-level KPI summaries while engineers require detailed device diagnostics. Embed dashboards directly into existing applications using QuickSight’s API, creating seamless user experiences.
Setting Up CloudWatch Metrics and Alarms
CloudWatch serves as the central monitoring hub for your AWS IoT solution, collecting and tracking metrics from all connected devices and services. Configure custom metrics to monitor device connectivity status, message throughput, and error rates. These metrics provide essential visibility into your IoT infrastructure’s health and performance.
Create meaningful alarm thresholds based on historical data patterns. Set up alarms for critical metrics like device disconnection rates exceeding 5% or message processing delays surpassing 30 seconds. Configure different alarm states – OK, ALARM, and INSUFFICIENT_DATA – to handle various scenarios gracefully.
Use CloudWatch composite alarms to combine multiple metrics into comprehensive health checks. For example, create a composite alarm that triggers when both device count drops below threshold AND error rates spike above normal levels. This approach reduces false positives and focuses attention on genuine issues.
Configure alarm actions to automatically respond to threshold breaches. Set up SNS notifications to alert operations teams, Lambda functions to trigger automated remediation, or Auto Scaling actions to adjust processing capacity. Create escalation procedures where minor issues generate tickets while critical failures immediately page on-call engineers.
Leverage CloudWatch Logs Insights to analyze IoT device logs and identify patterns. Create custom queries to track specific error messages, authentication failures, or performance bottlenecks across your device fleet.
Implementing Real-time Stream Processing with Kinesis Analytics
Kinesis Analytics enables sophisticated real-time IoT analytics by processing streaming data as it flows from devices to the cloud. Create SQL-based applications that analyze IoT data streams in real-time, detecting patterns and anomalies within milliseconds of data arrival.
Configure tumbling windows to aggregate sensor readings over specific time intervals. For example, calculate average temperature readings every 5 minutes or count device events per hour. Sliding windows help detect trends by continuously updating calculations as new data arrives, perfect for monitoring gradually changing conditions.
Implement complex event processing to identify meaningful patterns across multiple data streams. Correlate data from different sensors to detect equipment failures before they occur. For instance, combine vibration, temperature, and power consumption data to predict motor failures with high accuracy.
Use Kinesis Analytics’ built-in anomaly detection functions to automatically identify unusual patterns in your IoT data streams. The RANDOM_CUT_FOREST algorithm excels at detecting outliers in time-series data without requiring predefined thresholds or historical training data.
Connect Kinesis Analytics outputs to various destinations based on processing results. Send aggregated metrics to CloudWatch for monitoring, route anomalies to Lambda functions for immediate action, or store processed results in S3 for historical analysis. This flexible architecture supports both real-time responses and batch analytics workflows.
Creating Automated Alert Systems for Anomaly Detection
Automated anomaly detection transforms reactive monitoring into proactive maintenance strategies. Combine multiple AWS services to create intelligent alerting systems that learn normal device behavior patterns and identify deviations automatically.
Deploy machine learning models using Amazon SageMaker to analyze historical IoT data and establish baseline behavior patterns for each device type. These models continuously learn and adapt to changing operational conditions, reducing false alarms while improving detection accuracy.
Configure multi-level alerting systems that escalate based on anomaly severity and persistence. Minor deviations might generate informational alerts, moderate anomalies trigger email notifications to operations teams, while critical issues immediately activate emergency response procedures.
Implement contextual alerting by enriching anomaly notifications with relevant metadata. Include device location, maintenance history, current operational status, and correlation with nearby devices. This context helps operators quickly understand the situation and take appropriate action.
Use AWS IoT Events to create sophisticated rule-based detection systems that monitor device states and trigger actions based on complex conditions. Create detector models that track equipment lifecycle stages and automatically schedule maintenance when usage patterns indicate potential issues.
Build feedback loops into your anomaly detection system by tracking alert accuracy and operator responses. Use this data to continuously refine detection algorithms and reduce noise in your alerting systems. Machine learning models improve over time as they process more operational data and receive feedback on detection quality.
Optimizing Performance and Reducing Operational Costs

Implementing Device Fleet Management at Scale
Managing hundreds or thousands of IoT devices requires a strategic approach that goes beyond basic connectivity. AWS IoT Device Management provides the foundation for efficient fleet operations, allowing you to organize devices into groups based on function, location, or deployment batch. This grouping capability becomes essential when rolling out firmware updates or configuration changes across specific device categories without affecting your entire fleet.
Device shadows play a crucial role in large-scale deployments by maintaining the desired state of each device, even when connectivity is intermittent. Instead of constantly polling devices for status updates, you can rely on shadows to track device configurations and sync changes when devices come back online. This approach significantly reduces bandwidth consumption and improves overall system reliability.
Jobs functionality enables you to execute remote operations across device groups with built-in retry mechanisms and progress tracking. Whether you’re deploying security patches or updating sensor calibration parameters, the jobs framework handles the complexity of coordinating updates across distributed devices while providing detailed execution reports.
Fleet indexing transforms device management from reactive troubleshooting to proactive monitoring. By indexing device attributes, connectivity status, and shadow data, you can quickly identify problematic devices, track firmware versions across your fleet, and generate compliance reports without manually querying individual devices.
Monitoring Data Transfer Costs and Usage Patterns
Data transfer represents one of the largest operational expenses in any AWS IoT solution. AWS IoT Core pricing includes message costs, device shadow operations, and rules engine executions, making cost monitoring essential for budget control. The AWS Cost Explorer provides detailed breakdowns of IoT-related charges, but implementing custom monitoring delivers more granular insights.
CloudWatch metrics automatically track message counts, connection minutes, and rule executions, giving you real-time visibility into usage patterns. Set up custom dashboards that display daily message volumes by device type, peak usage hours, and month-over-month growth trends. This data helps identify which devices or applications drive the highest costs and whether usage aligns with business expectations.
Device-level cost allocation becomes possible by tagging resources consistently across your IoT cloud architecture. Apply tags that reflect business units, geographic regions, or project codes, then use these tags to generate detailed cost reports. You might discover that certain device types generate excessive telemetry data or that specific locations experience higher connectivity costs due to network conditions.
Implement cost anomaly detection using CloudWatch alarms that trigger when message volumes exceed baseline patterns. Sudden spikes often indicate device malfunctions, firmware bugs, or security issues that require immediate attention. Early detection prevents runaway costs while maintaining system performance.
Setting Up Automated Scaling Policies
Your end-to-end IoT architecture must handle varying workloads without manual intervention or service degradation. AWS IoT Core automatically scales to accommodate connection and message volume changes, but downstream services require explicit scaling configurations to match IoT data flows.
Lambda functions processing IoT data should use reserved concurrency settings to prevent overwhelming downstream databases or APIs. Configure dead letter queues for functions that process critical device messages, ensuring no data loss during scaling events or temporary failures. Monitor function duration and error rates to identify performance bottlenecks before they impact device operations.
Kinesis Data Streams requires shard management as IoT data volumes grow. Use Kinesis Scaling Utility or implement custom CloudWatch-based scaling to add shards when incoming data rates approach capacity limits. Consider Kinesis Data Firehose for scenarios where real-time processing isn’t required, as it automatically scales and reduces operational overhead.
DynamoDB tables storing device data benefit from on-demand billing for unpredictable workloads or provisioned capacity with auto-scaling for steady-state operations. Configure separate read and write capacity scaling policies based on your application’s access patterns. Device telemetry typically requires higher write throughput during business hours, while analytics queries might drive read capacity needs.
Time-based scaling policies help optimize costs for predictable usage patterns. Many IoT deployments experience higher activity during specific hours or days, making scheduled scaling an effective cost reduction strategy. Combine time-based policies with metric-based triggers to handle both expected and unexpected load changes.

Creating a complete AWS IoT solution doesn’t have to feel overwhelming when you break it down into manageable pieces. You’ve learned how to set up your hardware, configure AWS IoT Core, and establish secure connections that keep your data safe. The real magic happens when you build those data processing pipelines and create dashboards that give you instant insights into what your devices are doing.
The beauty of AWS IoT lies in its ability to scale with your needs while keeping costs under control. Start small with a few devices and basic analytics, then gradually add more sophisticated features as your project grows. Remember to monitor your spending and optimize your setup regularly – those small tweaks can add up to significant savings over time. Your IoT journey is just beginning, and with these building blocks in place, you’re ready to turn your device data into actionable business intelligence.


