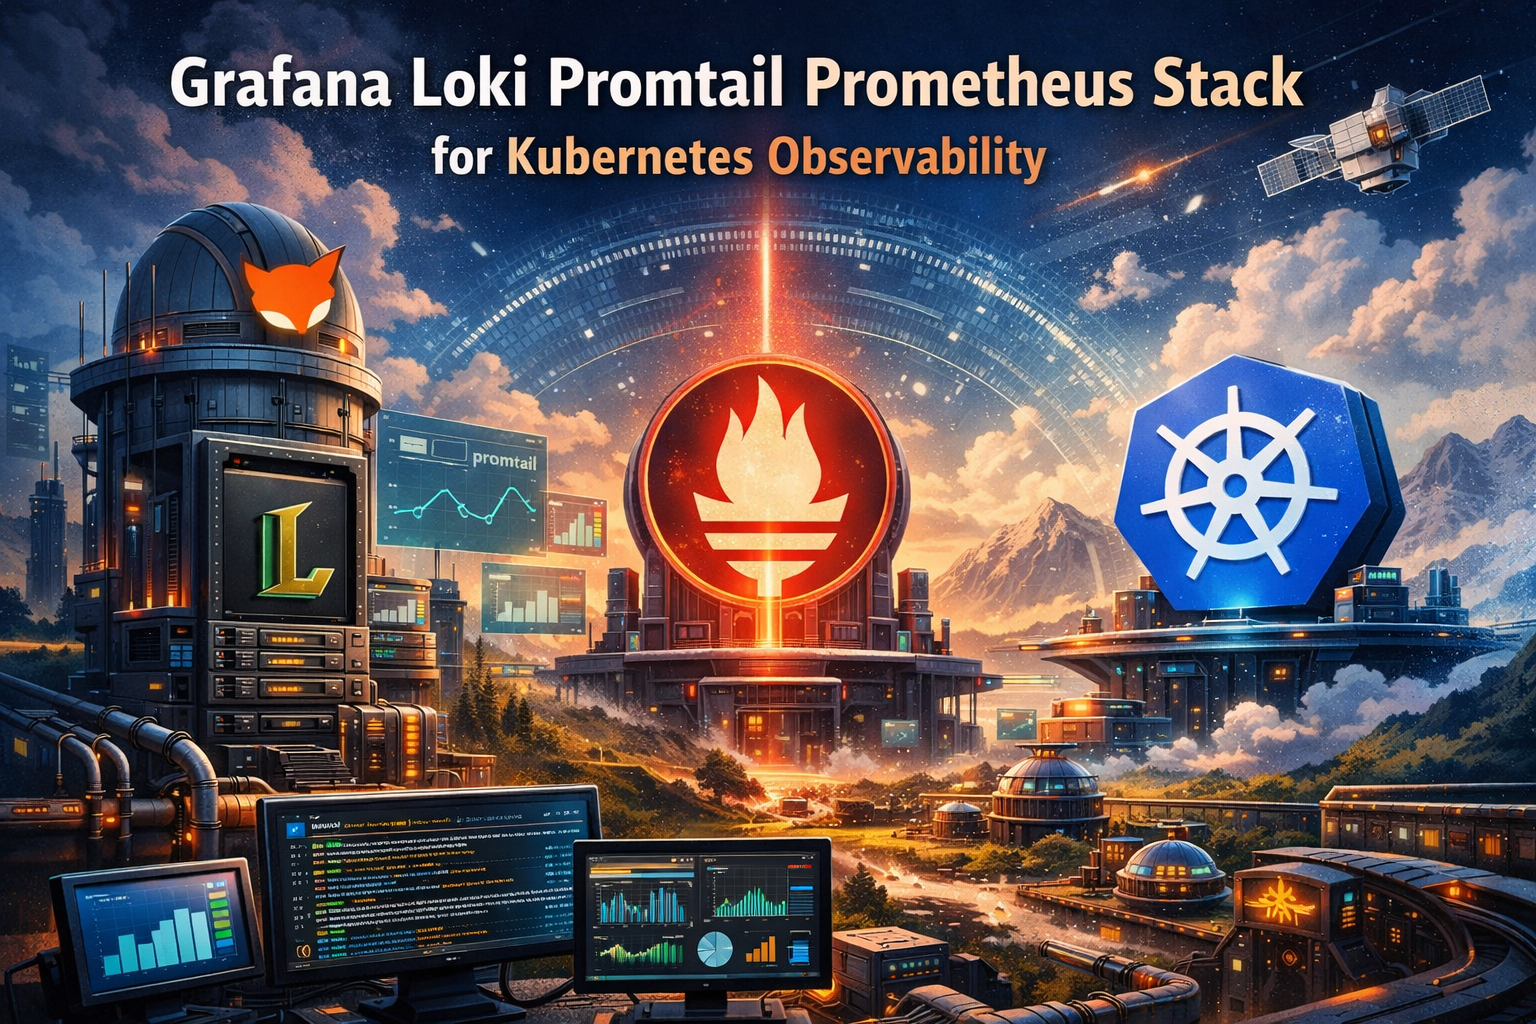
Kubernetes observability becomes critical when managing complex containerized environments at scale. The Grafana Loki Promtail stack combined with Prometheus monitoring Kubernetes creates a powerful solution for tracking application performance, troubleshooting issues, and maintaining system health.
This guide targets DevOps engineers, SRE teams, and platform administrators who need to implement comprehensive monitoring and logging across their Kubernetes clusters. You’ll learn how to build a complete observability foundation that gives you real-time insights into your infrastructure.
We’ll walk through setting up centralized log management Kubernetes using Loki log aggregation and show you how to deploy Promtail agent deployment across your nodes for seamless log collection. You’ll also discover how to integrate Kubernetes metrics collection with Prometheus and create effective Grafana dashboard alerting that keeps your team informed about critical system events.
Understanding the Core Components of Modern Kubernetes Observability
Grafana’s role as the unified visualization dashboard
Grafana serves as the central command center for your Kubernetes observability stack, transforming raw metrics and logs into actionable insights through powerful visualizations. This open-source platform connects seamlessly with Prometheus, Loki, and countless other data sources, creating comprehensive dashboards that give you real-time visibility into your cluster’s health. With its intuitive query builder and extensive templating capabilities, Grafana enables teams to create custom views for different stakeholders, from developers tracking application performance to operations teams monitoring infrastructure health. The platform’s alerting system integrates directly with popular notification channels, ensuring critical issues reach the right people instantly.
Loki’s log aggregation capabilities for centralized monitoring
Loki revolutionizes Kubernetes logging by treating logs like metrics, using labels for efficient indexing without full-text search overhead. Unlike traditional logging solutions that index everything, Loki only indexes metadata labels, dramatically reducing storage costs while maintaining query performance. The system stores log data in object storage like S3 or GCS, making it highly scalable and cost-effective for large Kubernetes environments. Loki’s integration with Grafana provides a unified experience where you can correlate logs with metrics in the same dashboard, jumping from a spike in error rates directly to the corresponding log entries that explain what went wrong.
Promtail’s efficient log collection and forwarding mechanisms
Promtail acts as the bridge between your Kubernetes pods and Loki, automatically discovering log sources and shipping them with minimal resource overhead. Deployed as a DaemonSet across your cluster, Promtail intelligently scrapes logs from containers, applying labels based on Kubernetes metadata like namespace, pod name, and container labels. The agent supports powerful parsing and relabeling capabilities, allowing you to extract structured data from unstructured logs and enrich them with contextual information. Promtail’s built-in service discovery works seamlessly with Kubernetes API, automatically adapting to cluster changes without manual configuration updates.
Prometheus metrics collection and alerting power
Prometheus stands as the backbone of Kubernetes metrics collection, using a pull-based model to scrape metrics from applications and infrastructure components. The system’s dimensional data model with labels enables flexible querying through PromQL, allowing you to slice and dice metrics across different dimensions like namespaces, services, or custom labels. Prometheus excels at storing time-series data efficiently, with built-in compression and retention policies that balance storage costs with data availability. The alerting capabilities trigger notifications based on metric thresholds and trends, integrating with Alertmanager to handle routing, grouping, and silencing of alerts across your Kubernetes observability stack.
Setting Up Loki for Centralized Log Management
Installing Loki in your Kubernetes cluster
Deploy Loki using Helm charts for the smoothest installation experience. Add the Grafana repository and install Loki with basic configurations that match your cluster size and expected log volume. The default deployment includes essential components like distributor, ingester, and querier services that handle log ingestion and queries efficiently.
helm repo add grafana https://grafana.github.io/helm-charts
helm install loki grafana/loki-stack --namespace logging --create-namespace
Configure resource limits and requests based on your cluster capacity. Start with moderate settings and scale up as your centralized log management needs grow across the Kubernetes environment.
Configuring storage backends for optimal performance
Choose between object storage (S3, GCS, Azure Blob) or filesystem storage depending on your performance requirements and budget. Object storage provides better scalability and durability for production Loki log aggregation workloads, while filesystem storage works well for development environments.
Set up proper storage class configurations that align with your retention policies and query patterns. Configure chunk storage and index storage separately to optimize read and write performance across your Kubernetes observability stack.
storage_config:
  boltdb_shipper:
    active_index_directory: /loki/index
    cache_location: /loki/index_cache
  filesystem:
    directory: /loki/chunks
Setting up log retention policies and indexing strategies
Define retention periods based on compliance requirements and storage costs. Implement automated cleanup processes that remove old log data while preserving recent entries for troubleshooting and analysis. Configure different retention periods for various log types and namespaces within your Kubernetes cluster.
Create efficient indexing strategies using label combinations that support your most common query patterns. Avoid high-cardinality labels that can impact query performance and storage efficiency in your Grafana Loki Promtail stack deployment.
limits_config:
  retention_period: 720h  # 30 days
  ingestion_rate_mb: 10
  ingestion_burst_size_mb: 20
Deploying Promtail Agents Across Your Infrastructure
Implementing Promtail as DaemonSet for comprehensive log collection
Deploying Promtail as a DaemonSet ensures every node in your Kubernetes cluster has a dedicated log collection agent running. This approach guarantees complete coverage across your infrastructure, automatically scaling with cluster growth. The DaemonSet configuration mounts host paths like /var/log and /var/lib/docker/containers to capture container logs, system logs, and application-specific outputs. Configure resource limits and requests to prevent Promtail from consuming excessive CPU or memory on worker nodes.
Configuring log parsing and labeling rules
Promtail’s configuration file defines parsing rules that extract meaningful data from raw log streams. Use regex patterns and structured log parsing to identify timestamps, log levels, and custom fields. Label extraction rules automatically tag logs with metadata like namespace, pod name, and container information. Create pipeline stages that filter, transform, and enrich log data before sending to Loki. Multi-line parsing handles stack traces and complex log formats that span multiple lines.
Optimizing resource allocation and performance tuning
Fine-tune Promtail’s performance by adjusting batch sizes, flush intervals, and buffer limits in the client configuration. Set appropriate memory limits to handle log volume spikes without pod restarts. Configure log rotation and compression to manage disk space on nodes. Monitor Promtail metrics through its built-in Prometheus endpoints to track ingestion rates, error counts, and queue depths. Use node affinity and tolerations to ensure Promtail pods run on all nodes, including master nodes if needed.
Setting up service discovery for dynamic environments
Enable Kubernetes service discovery in Promtail to automatically detect new pods and services as they’re created or destroyed. Configure role-based access control (RBAC) permissions allowing Promtail to watch cluster resources and read pod metadata. Use relabeling rules to dynamically assign labels based on pod annotations, service names, or namespace properties. Implement conditional scraping rules that include or exclude specific workloads based on labels or annotations, providing flexible control over what gets monitored in dynamic Kubernetes environments.
Integrating Prometheus for Comprehensive Metrics Collection
Deploying Prometheus operator for automated management
The Prometheus operator simplifies Kubernetes metrics collection by automating deployment, configuration, and lifecycle management of Prometheus instances. Install it using Helm or kubectl manifests, which creates custom resource definitions for ServiceMonitor, PodMonitor, and PrometheusRule objects. The operator automatically discovers targets, manages configuration updates, and handles Prometheus server scaling without manual intervention, making Kubernetes observability seamless.
Configuring service monitors and pod monitors
ServiceMonitors and PodMonitors enable automatic target discovery for Prometheus monitoring Kubernetes workloads. ServiceMonitors watch services with specific labels and scrape metrics from endpoints, while PodMonitors directly target pods matching label selectors. Configure scraping intervals, metric paths, and authentication parameters through these resources. The operator translates these configurations into Prometheus scrape configs, ensuring your Kubernetes metrics collection captures application and infrastructure performance data automatically.
Setting up custom metrics and recording rules
Recording rules precompute frequently-used queries and create custom metrics from existing data, reducing dashboard load times and enabling complex alerting scenarios. Define rules using PromQL expressions that aggregate metrics over time windows or calculate rates and percentiles. Store rules in PrometheusRule custom resources, where the operator manages their lifecycle. Custom metrics help track business KPIs alongside infrastructure metrics, providing comprehensive observability stack setup for your applications.
Building Powerful Dashboards and Alerting in Grafana
Creating Custom Dashboards for Application and Infrastructure Monitoring
Building effective Grafana dashboards for Kubernetes observability requires a strategic approach that balances comprehensive monitoring with usability. Start by organizing your dashboards into logical categories – create separate views for cluster-level metrics, node performance, pod health, and application-specific monitoring. Use Prometheus data sources to display critical Kubernetes metrics like CPU and memory utilization, network I/O, and storage consumption across namespaces. Design your panels with appropriate time ranges and refresh intervals to match your operational needs. Include key performance indicators such as request rates, error percentages, and response times from your application metrics. Group related visualizations together and use consistent color schemes and naming conventions across all dashboards. Add annotations to mark deployment events and maintenance windows, providing context for metric anomalies. Configure drill-down capabilities between dashboards to enable seamless navigation from high-level cluster views to specific pod or container details.
Implementing LogQL Queries for Advanced Log Analysis
LogQL serves as the foundation for extracting meaningful insights from your Loki log aggregation system. Master the stream selector syntax to filter logs by labels like job, instance, or custom application labels. Use line filter expressions with operators like |=, !=, and |~ to search for specific patterns or exclude unwanted log entries. Leverage label filter expressions to parse structured logs and extract key-value pairs for analysis. Implement metric queries using functions like rate(), count_over_time(), and sum by() to transform log data into quantifiable metrics. Create complex queries that combine multiple filter stages to drill down into specific error conditions or performance issues. Use range vector selectors to analyze log patterns over time periods, identifying trends in error rates or application behavior. Build queries that correlate log events with metric data from Prometheus, providing a complete picture of system health. Practice using unwrap expressions to extract numeric values from log lines for statistical analysis and threshold monitoring.
Setting Up Intelligent Alerting Rules and Notification Channels
Effective alerting in Grafana requires careful balance between comprehensive coverage and alert fatigue prevention. Configure alert rules using both Prometheus metrics and Loki log data to create multi-dimensional monitoring coverage. Set up notification channels for different team responsibilities – route infrastructure alerts to operations teams while sending application-specific alerts to development groups. Use alert grouping and timing controls to prevent notification storms during widespread outages. Implement escalation policies that increase alert severity and expand recipient lists for unacknowledged critical issues. Create meaningful alert messages that include relevant context like affected services, current metric values, and suggested remediation steps. Configure different notification methods including Slack, email, PagerDuty, or webhook integrations based on alert severity and team preferences. Use alert annotations to provide runbook links and historical context for recurring issues. Set up maintenance windows and alert silencing rules to prevent false notifications during planned maintenance activities.
Designing Role-Based Access Controls for Team Collaboration
Implement Grafana’s role-based access control system to ensure teams have appropriate access levels while maintaining security boundaries. Create organization-level roles that align with your company structure, separating development teams, operations groups, and management stakeholders. Configure folder permissions to restrict dashboard editing capabilities while allowing read access across teams. Set up data source permissions to control which teams can query specific Prometheus or Loki instances, especially important in multi-tenant environments. Use team synchronization with external authentication providers like LDAP or OAuth to automatically manage user permissions based on existing organizational structure. Create shared folders for common dashboards while maintaining team-specific spaces for specialized monitoring needs. Implement dashboard provisioning through configuration files to maintain consistency and enable version control of critical monitoring views. Configure audit logging to track dashboard changes and access patterns for security compliance. Design permission hierarchies that allow senior team members to modify alerts and dashboards while restricting junior members to read-only access.
Optimizing Performance and Troubleshooting Common Issues
Fine-tuning Resource Allocation Across the Stack
Resource optimization starts with understanding your Kubernetes observability stack’s actual usage patterns. Loki typically consumes significant memory during query operations, so allocate at least 2GB RAM and consider vertical pod autoscaling. Promtail agents require minimal resources but multiply across nodes – limit CPU to 100m and memory to 128Mi per instance. Prometheus memory requirements scale with metric cardinality, often needing 4-8GB in production environments. Configure resource requests conservatively and set higher limits to prevent OOM kills. Monitor resource utilization through Grafana dashboards and adjust based on peak usage patterns. Use node selectors and affinity rules to distribute workloads effectively across your cluster while avoiding resource contention.
Resolving Connectivity and Configuration Problems
Network connectivity issues plague many Kubernetes logging monitoring deployments. Check service discovery configuration first – Promtail must reach Loki endpoints, and Prometheus requires proper service monitors. Verify DNS resolution between components using kubectl exec and nslookup commands. Common configuration problems include incorrect label selectors, missing RBAC permissions, and wrong port mappings. Enable debug logging temporarily to trace connection failures. Validate YAML syntax and indentation carefully, as minor errors break entire configurations. Test connectivity using port-forward commands to isolate networking from configuration issues. Certificate problems often cause TLS handshake failures – ensure proper secret mounting and certificate chain validity.
Implementing Backup and Disaster Recovery Strategies
Your observability stack needs protection against data loss and service interruption. Loki stores data in object storage like S3, making backups straightforward through bucket versioning and cross-region replication. Prometheus local storage requires regular snapshots using the admin API or volume-level backups. Export critical dashboard configurations as JSON files and store them in version control. Document all custom configuration files and alerting rules. Create runbooks for common failure scenarios including node failures, storage issues, and network partitions. Test recovery procedures regularly in staging environments. Consider multi-cluster deployments for high availability, replicating configurations across regions. Implement monitoring for your monitoring stack itself to detect issues before they impact observability.
The combination of Grafana, Loki, Promtail, and Prometheus creates a powerful observability stack that transforms how you monitor and troubleshoot your Kubernetes clusters. By centralizing logs with Loki, collecting metrics with Prometheus, and shipping data seamlessly through Promtail, you get complete visibility into your infrastructure. The real magic happens when Grafana brings everything together, letting you build dashboards that tell the story of your applications and set up alerts that catch problems before they impact users.
Ready to level up your Kubernetes monitoring game? Start small by deploying this stack on a development cluster first. Get comfortable with the basics of log queries and metric collection, then gradually expand to production workloads. Remember that good observability isn’t just about having the tools—it’s about asking the right questions and knowing where to look when things go wrong. Your future self will thank you when you can quickly pinpoint issues instead of spending hours playing detective with scattered logs and metrics.


