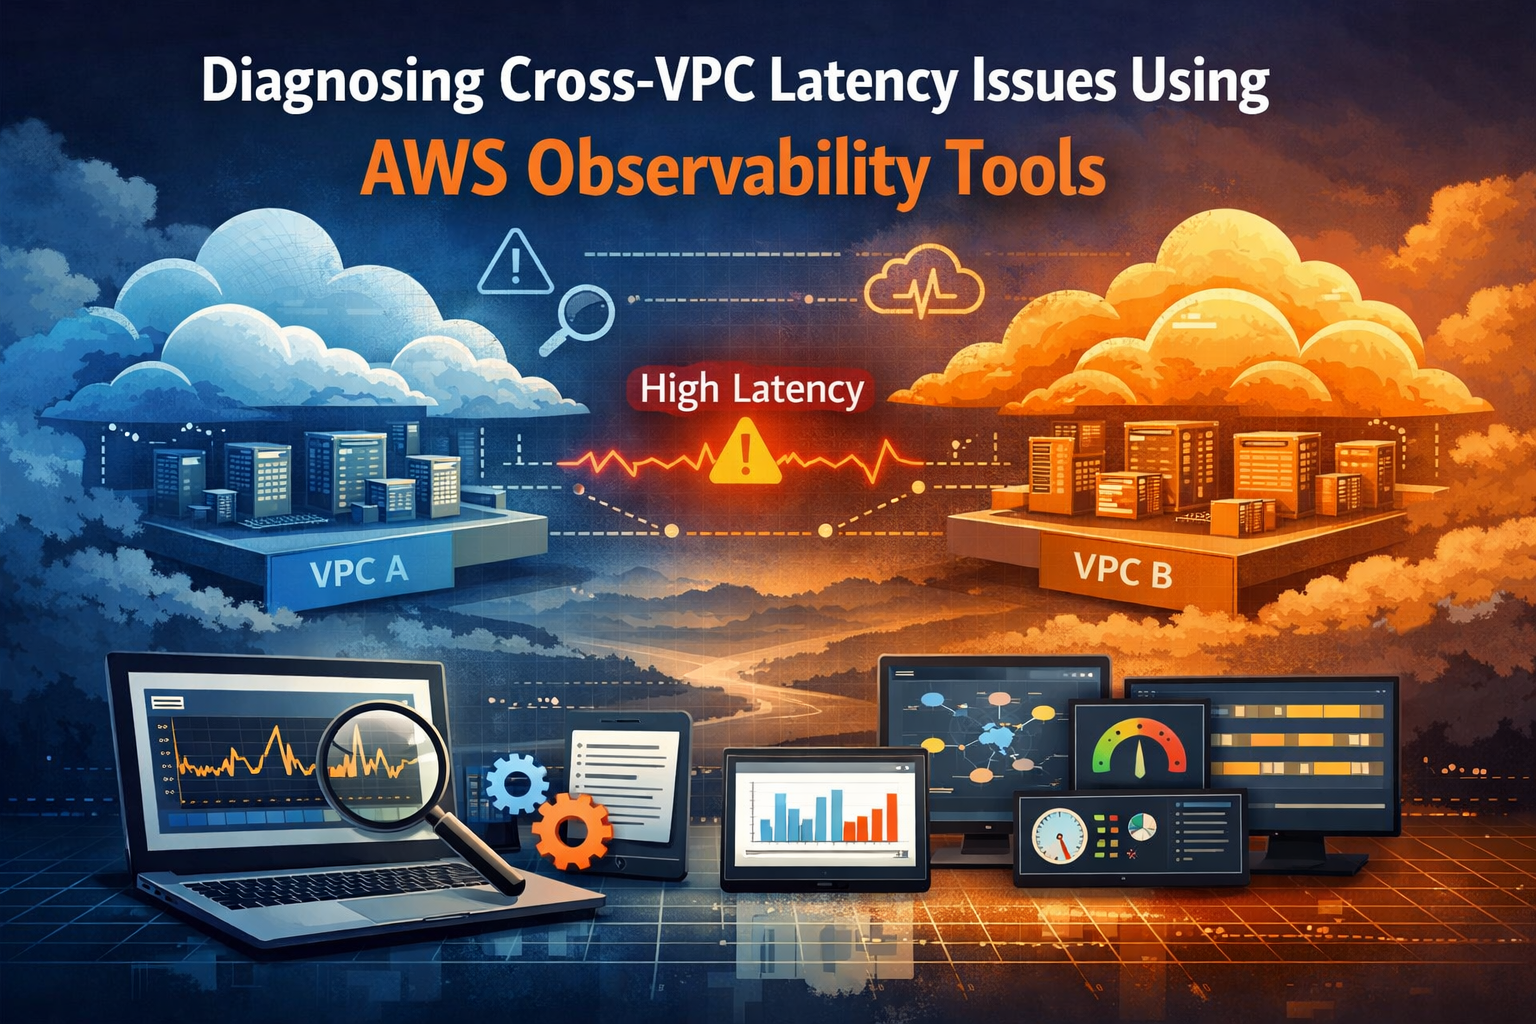
When applications running across multiple VPCs start responding slowly or timing out unexpectedly, cross-vpc latency issues can bring your entire distributed system to a crawl. This comprehensive guide is designed for DevOps engineers, cloud architects, and SREs who need to quickly identify and resolve AWS network latency diagnosis problems before they impact users.
Getting to the bottom of VPC network performance monitoring challenges requires the right combination of tools and techniques. You’ll learn how to harness AWS observability tools like CloudWatch network metrics to spot performance bottlenecks, use AWS X-Ray distributed tracing to trace request paths across VPC boundaries, and apply VPC reachability analyzer to validate your network configuration. We’ll also cover practical cross-vpc connectivity troubleshooting strategies that help you optimize performance based on what your diagnostic data reveals.
By the end of this guide, you’ll have a clear roadmap for implementing AWS network monitoring tools and VPC performance optimization techniques that keep your multi-VPC applications running smoothly.
Understanding Cross-VPC Network Architecture Fundamentals
Identifying VPC peering connection types and configurations
Cross-VPC connectivity patterns vary significantly based on your architectural choices. VPC peering connections create direct network routes between virtual private clouds, enabling private IP communication without internet gateways or NAT devices. Full mesh peering connects every VPC to every other VPC, creating multiple direct paths but increasing complexity exponentially. Hub-and-spoke configurations route all traffic through a central VPC, simplifying management but potentially creating bottlenecks. Star topology reduces connection overhead while maintaining centralized control. Each configuration impacts latency differently – direct peering minimizes hops while hub-and-spoke adds routing delays. Route table configurations determine actual traffic paths, and overlapping CIDR blocks can prevent successful peering altogether.
Recognizing inter-region vs intra-region connectivity patterns
Network latency characteristics change dramatically between same-region and cross-region VPC connections. Intra-region peering typically delivers sub-millisecond latencies with consistent performance, leveraging AWS’s high-speed regional backbone infrastructure. Cross-region connections introduce additional network hops through AWS’s global network, adding 10-100 milliseconds depending on geographic distance. Internet routing paths between regions can vary, creating unpredictable latency spikes during peak traffic periods. Data transfer costs differ significantly – intra-region peering remains free while cross-region transfers incur charges. Regional availability zone placement affects performance even within single regions, as AZ-to-AZ communication adds minor latency overhead compared to same-AZ traffic flows.
Mapping traffic flow paths between virtual private clouds
Effective cross-VPC latency diagnosis requires understanding actual packet routing paths. AWS Route 53 Resolver handles DNS queries across VPC boundaries, potentially adding resolution delays to application requests. Security groups and network ACLs filter traffic at different network layers, creating processing overhead that accumulates across complex multi-VPC architectures. Transit Gateway implementations consolidate routing but introduce additional network hops compared to direct VPC peering. Load balancers, NAT gateways, and proxy servers in the traffic path each contribute processing delays. VPC endpoints for AWS services create alternative routing paths that bypass internet gateways, potentially reducing latency for service API calls while adding complexity to traffic flow analysis.
Establishing baseline performance expectations
Realistic performance baselines prevent false positive alerts and help identify genuine AWS network latency diagnosis issues. Same-region VPC peering should consistently deliver under 1ms latency for small packets, while cross-region connections vary from 10-150ms based on geographic separation. Application-layer protocols add overhead – HTTP requests include DNS resolution, TCP handshake, and SSL negotiation delays beyond basic network transit time. Database connections maintain persistent sessions but initial connection establishment can take several round trips. Microservices architectures multiply these delays across service boundaries, making end-to-end latency significantly higher than individual network segments. Peak traffic periods can increase latency by 10-50% due to AWS infrastructure sharing, requiring baseline measurements during both normal and high-load conditions.
Recognizing Common Cross-VPC Latency Symptoms
Detecting Application Response Time Degradation
When your applications start crawling across VPCs, users notice immediately. Look for response times that suddenly spike from milliseconds to seconds, especially during peak traffic periods. CloudWatch network metrics reveal patterns where cross-VPC connectivity troubleshooting becomes essential – requests that previously completed in 100ms now take 2-3 seconds. Monitor API gateway latencies, database connection times, and service-to-service communication delays. These degradations often appear gradually, making them harder to catch without proper AWS network monitoring tools tracking baseline performance versus current metrics.
Identifying Intermittent Connection Timeouts
Connection timeouts create the most frustrating user experiences because they’re unpredictable. Your application works fine one moment, then fails the next. Watch for HTTP 504 errors, database connection failures, and microservice timeouts that occur sporadically across your VPC network performance monitoring dashboard. These timeouts often manifest as failed health checks, partial page loads, or incomplete API responses. The key indicator is inconsistency – some requests succeed while others fail without any apparent pattern, pointing to underlying cross-vpc latency issues.
Spotting Bandwidth Throttling Indicators
Bandwidth throttling sneaks up on you through subtle performance drops rather than complete failures. Your AWS observability tools will show packet loss percentages climbing above normal thresholds, typically exceeding 1-2% during data-intensive operations. Network utilization graphs display consistent plateaus at specific throughput levels, indicating artificial caps. File transfers slow to crawls, video streaming stutters, and bulk data operations take significantly longer than expected. These symptoms worsen during business hours when multiple applications compete for the same network resources across VPC connections.
Leveraging CloudWatch for Network Performance Monitoring
Setting up VPC Flow Logs for traffic analysis
VPC Flow Logs capture network traffic metadata between your VPCs, giving you detailed insights into cross-vpc connectivity patterns. Enable Flow Logs at the VPC, subnet, or network interface level to track source and destination IPs, ports, protocols, and traffic volumes. Configure logs to stream to CloudWatch Logs or S3 for analysis. Focus on fields like srcaddr, dstaddr, srcport, dstport, and action to identify blocked traffic and routing issues. Set up log retention policies to balance cost with historical data needs. Use CloudWatch Insights to query Flow Logs data and identify traffic patterns that might indicate cross-vpc latency issues.
Creating custom metrics for latency tracking
CloudWatch custom metrics help you track specific network latency indicators that standard AWS metrics don’t cover. Create custom metrics using the AWS CLI or SDKs to measure application-level response times between VPCs. Monitor round-trip times for database connections, API calls, and inter-service communication. Set up metrics to track percentiles (P50, P95, P99) rather than just averages to catch latency spikes. Use CloudWatch Agent to collect system-level network metrics like packet loss and retransmission rates. Implement metric filters on VPC Flow Logs to automatically generate metrics for specific traffic patterns or error conditions.
Configuring automated alerts for performance thresholds
Smart alerting prevents cross-vpc latency issues from impacting your applications. Set up CloudWatch alarms that trigger when latency metrics exceed your performance baselines. Configure composite alarms that combine multiple metrics to reduce false positives. Use dynamic thresholds that adapt to normal traffic patterns rather than static values. Set up different alert levels – warning alerts for minor degradation and critical alerts for service-affecting issues. Integrate alerts with SNS topics to notify your team via email, SMS, or Slack. Create escalation policies that automatically engage different team members based on alert severity and duration.
Building comprehensive dashboards for real-time visibility
Real-time dashboards give your team immediate visibility into cross-vpc network performance. Create CloudWatch dashboards that display key metrics like connection latency, throughput, and error rates across all your VPC connections. Add widgets showing VPC Flow Logs analysis, custom latency metrics, and alarm status. Use geographical maps to visualize traffic flows between different AWS regions and availability zones. Set up automatic refresh intervals to keep data current. Share dashboards with stakeholders and embed them in your operations center displays. Include comparison views showing current performance against historical baselines to quickly spot anomalies.
Utilizing AWS X-Ray for Distributed Tracing Analysis
Implementing service map visualization across VPCs
AWS X-Ray creates comprehensive visual maps showing how requests flow between services across different VPCs, revealing hidden dependencies and communication patterns. The service map displays response times, error rates, and throughput for each component, making it easier to spot performance degradation points in cross-vpc connectivity troubleshooting scenarios. You can filter traces by specific time ranges, service names, or annotation values to focus on problematic areas. The visual representation helps teams quickly identify which VPC boundaries are causing delays and understand the complete request journey through your distributed architecture.
Pinpointing bottlenecks in multi-tier applications
Distributed tracing with AWS X-Ray captures detailed timing information for each service call, database query, and external API request across your multi-tier application stack. When applications span multiple VPCs, X-Ray segments show exactly where time is spent – whether in network transit, application processing, or waiting for downstream services. The trace timeline breaks down total request duration into granular components, highlighting slow database connections, inefficient API calls, or network latency issues. This granular visibility enables precise identification of performance bottlenecks that traditional monitoring tools might miss.
Analyzing request latency breakdown by network segments
X-Ray provides detailed latency analysis by capturing timing data for each network hop and service interaction within your cross-VPC architecture. The trace details show subsegment durations, allowing you to compare processing time versus network transit time across different VPC boundaries. You can analyze patterns in AWS network latency diagnosis data to determine if delays stem from inter-VPC routing, security group rules, or application-level processing. Custom annotations and metadata help correlate latency spikes with specific network paths, enabling targeted optimization of VPC performance and routing configurations.
Implementing VPC Reachability Analyzer for Path Validation
Verifying network connectivity between source and destination
VPC Reachability Analyzer serves as your first line of defense when diagnosing cross-vpc latency issues by validating end-to-end connectivity paths. This powerful AWS network monitoring tool simulates network traffic flow between source and destination endpoints, revealing whether packets can successfully traverse your VPC infrastructure. You can configure analysis paths between EC2 instances, load balancers, NAT gateways, and VPC endpoints across different VPCs to identify potential bottlenecks. The analyzer examines every hop along the network path, checking route tables, security groups, and network ACLs to determine if traffic flows as expected. When cross-vpc connectivity troubleshooting becomes complex, this tool provides visual path analysis that highlights exactly where communication breaks down, saving hours of manual investigation.
Identifying misconfigured security groups and NACLs
Security group and Network ACL misconfigurations often masquerade as latency problems when they’re actually blocking traffic entirely. The Reachability Analyzer examines security group rules at both source and destination instances, checking for proper ingress and egress permissions on required ports and protocols. It also validates Network ACL configurations at the subnet level, which operate as stateless firewalls that can silently drop return traffic. Common issues include overly restrictive outbound rules, missing protocol specifications, or conflicting rule precedence that prevents proper bidirectional communication. The analyzer’s detailed findings report pinpoints exactly which security group or NACL rule is causing connectivity failures, allowing you to quickly remediate configuration errors that appear as performance issues.
Detecting routing table inconsistencies
Routing table problems frequently manifest as intermittent connectivity or increased latency in cross-VPC scenarios. VPC Reachability Analyzer traces the complete routing path from source to destination, identifying missing routes, incorrect targets, or circular routing patterns that cause packet delays. It validates VPC peering connections, transit gateway attachments, and internet gateway configurations to ensure traffic takes the most efficient path. The tool catches subtle issues like asymmetric routing where outbound and return paths differ, potentially causing connection timeouts that look like latency spikes. Route propagation delays and conflicting route priorities become visible through the analyzer’s comprehensive path mapping, helping you optimize routing decisions for better AWS network latency diagnosis.
Troubleshooting DNS resolution issues
DNS resolution failures often appear as application timeouts rather than obvious connectivity problems, making them tricky to diagnose during VPC performance optimization efforts. The Reachability Analyzer helps identify DNS-related connectivity issues by validating paths to DNS servers and checking if proper DNS resolution services are accessible. It examines whether EC2 instances can reach Route 53 resolvers, custom DNS servers, or on-premises DNS infrastructure through VPC endpoints or peering connections. The tool reveals when DNS queries are being blocked by security groups or NACLs, causing applications to hang while waiting for name resolution. By validating DNS connectivity paths alongside application traffic flows, you can distinguish between actual network latency and DNS resolution delays that impact overall application performance.
Optimizing Network Performance Based on Diagnostic Findings
Right-sizing instance types for network requirements
Network-intensive workloads demand instances with sufficient bandwidth allocation to prevent bottlenecks in cross-vpc connectivity troubleshooting scenarios. The m5n, c5n, and r5n instance families provide enhanced networking capabilities, delivering up to 100 Gbps of network performance. Choose instances based on your baseline and burst bandwidth requirements rather than just CPU or memory needs. Smaller instance types often become the limiting factor in cross-VPC communication, creating artificial latency that diagnostic tools will consistently flag.
Implementing placement groups for reduced latency
Cluster placement groups dramatically reduce network latency by physically co-locating instances within the same Availability Zone, achieving sub-millisecond latencies for tightly coupled applications. For cross-VPC scenarios, partition placement groups offer balanced performance by distributing instances across multiple underlying hardware while maintaining low-latency communication paths. Spread placement groups work best for fault tolerance but sacrifice some network performance. When AWS network latency diagnosis reveals consistent delays between specific instance pairs, placement group optimization often provides immediate improvement without architectural changes.
Configuring enhanced networking features
Single Root I/O Virtualization (SR-IOV) and Elastic Network Adapter (ENA) support must be enabled to achieve optimal VPC network performance monitoring results. These features bypass the hypervisor layer, reducing CPU overhead and improving packet-per-second performance by up to 20x. Enable enhanced networking on existing instances through instance attributes, though newer instance types activate these features by default. Jumbo frames (9000 MTU) can boost throughput for large data transfers between VPCs, but require end-to-end configuration across your entire network path to prevent fragmentation issues.
Adjusting security group rules for optimal throughput
Overly restrictive security group configurations create unnecessary processing overhead that CloudWatch network metrics will expose as increased latency. Consolidate rules where possible and avoid using individual IP addresses when CIDR blocks suffice. Remove unused rules that force the network stack to evaluate unnecessary conditions for each packet. Security groups with hundreds of rules significantly impact network performance, especially for high-throughput applications. Consider using AWS X-Ray distributed tracing to identify which security group evaluations consume the most processing time during cross-VPC communication flows.
Cross-VPC latency issues can seriously impact your application performance, but you don’t have to struggle with them blindly. AWS gives you powerful observability tools like CloudWatch, X-Ray, and VPC Reachability Analyzer that work together to pinpoint exactly what’s causing slowdowns in your network. By understanding your cross-VPC setup, watching for common latency warning signs, and using these diagnostic tools systematically, you can quickly identify bottlenecks and performance problems.
The real game-changer comes when you act on what these tools tell you. Don’t just collect metrics and traces – use them to make smart optimization decisions about your network architecture. Start monitoring your cross-VPC performance today, and when issues pop up, you’ll have the data and insights you need to fix them fast. Your applications and users will thank you for the smoother, more reliable experience.