Amazon CloudWatch monitoring transforms how AWS users track, alert on, and automate their cloud infrastructure. This powerful AWS monitoring tool goes beyond basic metrics collection to deliver intelligent insights that keep your applications running smoothly and your costs under control.
This guide is designed for AWS engineers, DevOps teams, and system administrators who want to master CloudWatch’s capabilities and build robust monitoring strategies. You’ll discover how to set up proactive monitoring that catches issues before they impact users and create automated responses that handle problems without manual intervention.
We’ll explore CloudWatch’s core monitoring features that give you complete visibility into your AWS environment. You’ll learn to build advanced alerting systems that predict and prevent downtime using smart thresholds and anomaly detection. Finally, we’ll cover automated response mechanisms that trigger self-healing actions, plus cost optimization strategies that deliver maximum monitoring value without breaking your budget.
Core CloudWatch Capabilities That Transform AWS Operations
Real-time metrics collection across all AWS services
Amazon CloudWatch monitoring automatically captures performance data from every AWS service in your infrastructure. Whether you’re running EC2 instances, RDS databases, or Lambda functions, CloudWatch collects essential metrics like CPU usage, memory consumption, and network throughput without requiring additional configuration. This built-in data collection creates a comprehensive view of your AWS environment, letting you spot performance bottlenecks and resource constraints before they impact users. The real-time nature means you’re always working with current information, making troubleshooting faster and more accurate.
Custom metric creation for application-specific monitoring
Beyond standard AWS metrics, CloudWatch empowers you to track business-critical application data through custom metrics. You can monitor user login rates, transaction volumes, or API response times by sending custom data points directly to CloudWatch using SDKs or APIs. This flexibility transforms generic AWS monitoring tools into tailored solutions that align with your specific business needs. Custom metrics integrate seamlessly with standard CloudWatch features, enabling you to create unified alerts and dashboards that combine infrastructure health with application performance insights.
Unified dashboard views for comprehensive system oversight
CloudWatch dashboard setup brings all your monitoring data into centralized, visual displays that eliminate the need to jump between multiple tools. You can create custom dashboards that combine EC2 metrics, RDS performance data, and application logs on a single screen, making it easy for teams to understand system health at a glance. These dashboards support real-time updates, historical trend analysis, and cross-service correlations that reveal dependencies and impact patterns. Share dashboards across teams or embed them in operational centers to keep everyone informed about critical system status.
Log aggregation and analysis from multiple sources
CloudWatch logs analysis centralizes log data from applications, operating systems, and AWS services into a searchable, queryable format. Instead of SSH-ing into individual servers to check log files, you can stream all logs to CloudWatch and use powerful filtering and search capabilities to identify issues quickly. The service automatically indexes log data, making it easy to find specific error messages or trace request flows across distributed systems. Integration with other AWS services means you can trigger automated responses based on log patterns or export data for long-term analysis and compliance reporting.
Advanced Alerting Systems That Prevent Downtime Before It Happens
Smart Threshold Configuration for Proactive Issue Detection
Dynamic thresholds in CloudWatch alerts adapt to your application’s natural patterns, catching anomalies before they become critical issues. Static thresholds often trigger false positives during traffic spikes or miss subtle degradation. Smart configuration involves setting baseline metrics during normal operations, then creating alerts that fire when performance deviates significantly from expected ranges. This proactive approach prevents downtime by identifying problems in their early stages.
Multi-Dimensional Alarm Strategies for Complex Architectures
Modern AWS environments require sophisticated CloudWatch monitoring tools that track multiple metrics simultaneously across different dimensions like instance types, availability zones, and application tiers. Creating composite alarms combines several metric conditions, providing comprehensive coverage for distributed systems. This strategy reduces alert fatigue while ensuring critical issues don’t slip through monitoring gaps in complex microservices architectures.
Integration with SNS for Instant Notification Delivery
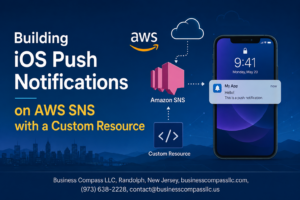
Amazon SNS transforms CloudWatch alerts automation into immediate action by delivering notifications through multiple channels simultaneously. Configure SNS topics to send alerts via email, SMS, mobile push notifications, or webhook integrations to ticketing systems. This multi-channel approach ensures the right team members receive critical alerts instantly, regardless of their location or preferred communication method, enabling rapid response to potential issues.
Automated Response Mechanisms That Eliminate Manual Interventions
Auto Scaling triggers based on performance metrics
CloudWatch metrics drive intelligent auto scaling decisions by monitoring CPU utilization, memory consumption, and application load patterns. When EC2 instances hit predefined thresholds, Auto Scaling Groups automatically launch or terminate instances, maintaining optimal performance while controlling costs. Custom metrics enable scaling based on business-specific indicators like queue depth or request latency.
Lambda function automation for self-healing systems
AWS automated monitoring solutions leverage Lambda functions to create responsive, self-healing infrastructure. CloudWatch alarms trigger Lambda functions that restart failed services, clear disk space, or rotate logs automatically. These serverless automation scripts respond within seconds to system anomalies, often resolving issues before users notice problems, dramatically reducing mean time to recovery.
EC2 instance management through automated actions
CloudWatch alerts automation extends to comprehensive EC2 lifecycle management through automated actions. Systems can automatically stop underutilized instances during off-peak hours, reboot unresponsive servers, or migrate workloads to healthier availability zones. These automated responses eliminate the need for 24/7 monitoring teams while ensuring consistent system reliability and performance across your AWS infrastructure.
Cost optimization through intelligent resource scaling
Smart resource scaling based on real-time metrics drives significant cost savings. CloudWatch monitoring identifies usage patterns and automatically scales down resources during low-demand periods. Predictive scaling analyzes historical data to anticipate traffic spikes, pre-scaling resources just before peak times. This intelligent approach reduces over-provisioning while maintaining performance, often cutting infrastructure costs by 30-50%.
Integration with Systems Manager for comprehensive automation
CloudWatch seamlessly integrates with AWS Systems Manager to create powerful automation workflows. Run Command documents execute maintenance tasks across fleets of instances when specific CloudWatch alarms trigger. Patch Manager schedules updates based on system health metrics, while Session Manager provides secure access for troubleshooting. This integration creates a unified automation platform that manages everything from routine maintenance to emergency response procedures.
Deep Insights Through Logs and Application Performance Monitoring
CloudWatch Logs for centralized log management and analysis
CloudWatch Logs transforms scattered application data into a unified monitoring powerhouse. Your applications, EC2 instances, Lambda functions, and AWS services automatically stream logs to centralized repositories where real-time analysis becomes effortless. The platform’s log groups organize data by source while log streams capture individual instance outputs. Built-in filtering capabilities let you search millions of entries instantly using pattern matching and timestamp queries. Custom metrics extraction converts raw log data into actionable insights, triggering automated responses when specific error patterns emerge. Integration with CloudWatch Insights provides SQL-like querying across massive datasets, uncovering performance bottlenecks and security anomalies that traditional monitoring misses.
Application Insights for code-level performance tracking
Application Insights delivers granular visibility into your application’s internal workings through distributed tracing and performance profiling. This AWS application performance monitoring tool automatically detects code-level issues, slow database queries, and inefficient API calls that impact user experience. The service maps entire request flows across microservices architectures, identifying exact bottlenecks within complex distributed systems. Custom instrumentation captures business-specific metrics while automatic discovery reveals dependencies between application components. Performance anomalies trigger immediate alerts, enabling development teams to resolve issues before users notice degraded service quality. Integration with CloudWatch dashboards provides stakeholders with real-time application health status and performance trends.
Container monitoring with enhanced observability
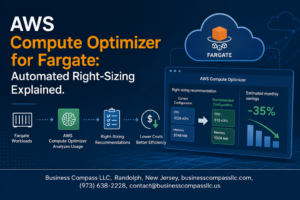
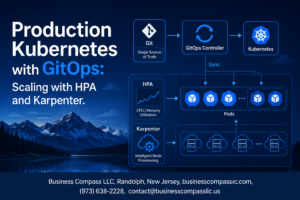
Container environments demand specialized monitoring approaches that CloudWatch delivers through Container Insights and enhanced metric collection. ECS, EKS, and Fargate workloads generate detailed performance data including CPU utilization, memory consumption, network throughput, and storage metrics at both container and cluster levels. The platform automatically discovers containerized applications and maps their resource consumption patterns, enabling precise capacity planning and cost optimization. Log aggregation from multiple container instances provides comprehensive troubleshooting capabilities while custom metrics track business-specific container performance indicators. Integration with AWS monitoring tools creates unified dashboards showing infrastructure health alongside application performance, giving operations teams complete visibility into containerized environments running across multiple availability zones.
Cost-Effective Monitoring Strategies That Maximize ROI
Retention policies that balance insight needs with storage costs
Setting up smart retention policies for CloudWatch logs analysis saves money while keeping critical data accessible. Configure shorter retention periods for debug logs (7-14 days) and longer periods for audit trails (1-7 years). Use lifecycle policies to automatically archive older metrics to cheaper storage tiers.
Metric filtering techniques to focus on critical data points
Create custom metric filters to capture only business-critical events and performance indicators. Filter out routine operational noise while preserving error patterns, security events, and performance anomalies. This targeted approach reduces CloudWatch cost optimization expenses by eliminating unnecessary data collection and storage.
Reserved capacity planning for predictable workloads
Reserve CloudWatch capacity for consistent monitoring workloads to achieve significant cost savings. Plan reserved instances based on historical usage patterns and growth projections. Combine reserved capacity with on-demand monitoring for variable workloads, creating a hybrid AWS monitoring best practices strategy that balances predictability with flexibility.
CloudWatch transforms how you manage your AWS infrastructure by bringing together monitoring, alerting, and automation into one powerful platform. From tracking basic metrics to setting up smart alerts that catch problems before they impact users, CloudWatch gives you the visibility and control you need to run reliable applications. The automated response features mean less time spent on repetitive tasks and more time focusing on what matters most to your business.
The real value comes from CloudWatch’s ability to turn data into actionable insights while keeping costs under control. By leveraging logs analysis, performance monitoring, and strategic alerting, you can build a monitoring strategy that actually saves money while improving system reliability. Start with the basics like CPU and memory monitoring, then gradually add more sophisticated automation as your team gets comfortable with the platform. Your future self will thank you for taking the time to set up proper monitoring today.