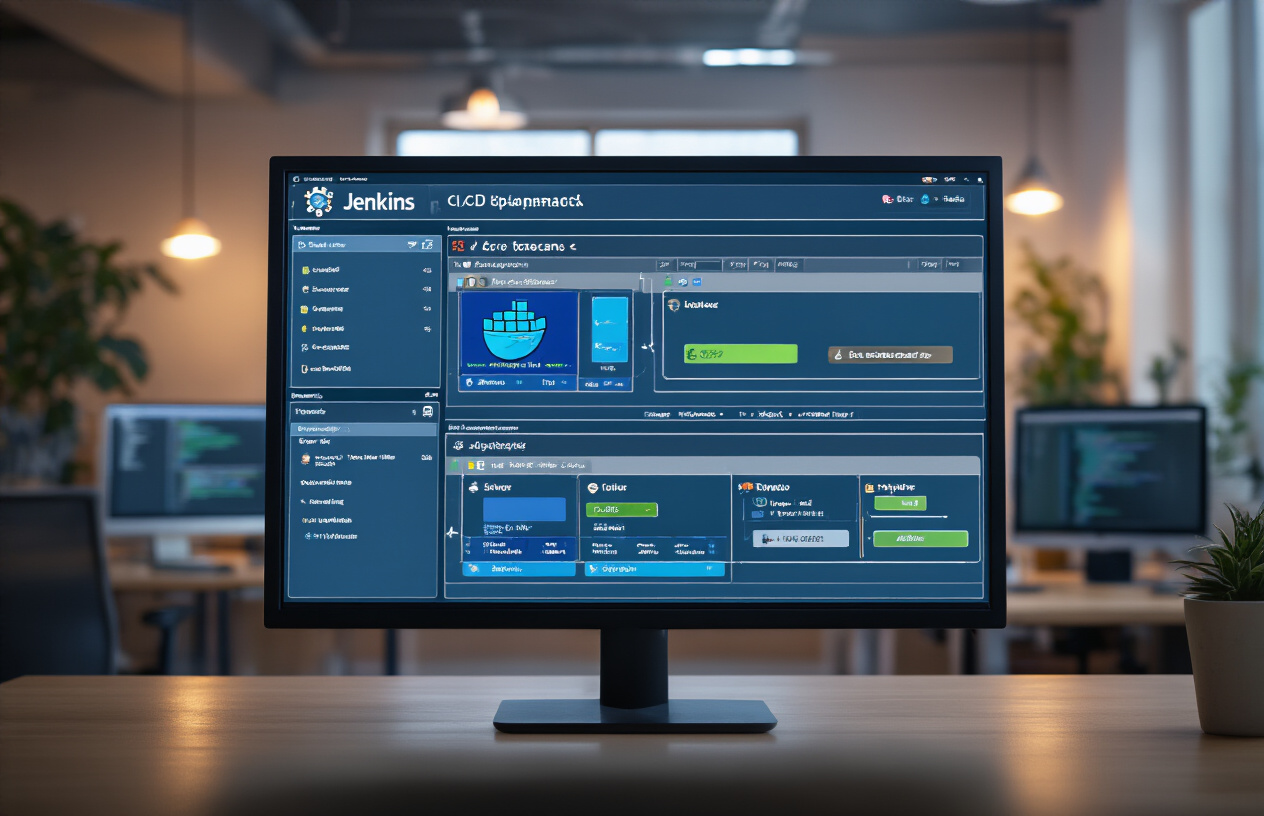
Running Jenkins on Kubernetes can transform your CI/CD pipeline from a bottleneck into a powerhouse that scales with your team’s needs. This guide walks DevOps engineers, platform teams, and Jenkins administrators through scaling Jenkins on Kubernetes with dynamic agents and smart caching to handle growing workloads without breaking the bank.
Jenkins Kubernetes integration solves the common problem of idle build servers eating resources while developers wait for available agents during peak times. Dynamic agent provisioning spins up pods only when builds run, then tears them down when finished. Smart caching strategies reduce build times by reusing dependencies and artifacts across jobs.
We’ll cover setting up your Jenkins Kubernetes infrastructure from scratch, including proper resource allocation and networking. You’ll learn how to implement dynamic agent provisioning that responds to build queues automatically. Finally, we’ll dive into Jenkins build caching techniques and horizontal scaling patterns that keep your Jenkins high availability Kubernetes setup running smoothly as your team grows.
By the end, you’ll have a Jenkins performance optimization strategy that scales Jenkins horizontally while keeping costs predictable and builds fast.
Setting Up Jenkins on Kubernetes Infrastructure
Installing Jenkins using Helm charts for rapid deployment
Helm charts make Jenkins Kubernetes deployment straightforward and repeatable. The official Jenkins Helm chart includes pre-configured values for production environments, supporting custom plugins, security settings, and resource limits. Install the Jenkins chart with customized values to match your infrastructure requirements and enable features like persistent volumes and ingress controllers for external access.
Configuring persistent storage for Jenkins data and plugins
Persistent volumes ensure Jenkins data survives pod restarts and updates. Create a StorageClass with appropriate provisioners (AWS EBS, Azure Disk, or GCE PD) and configure the Jenkins Helm chart to use persistent volume claims. Store critical data like job configurations, build history, and installed plugins on dedicated volumes with sufficient IOPS and backup policies for data protection.
Establishing secure networking and service discovery
Network policies control traffic flow between Jenkins pods and external services. Configure ingress controllers with TLS termination for secure external access and use Kubernetes services for internal communication. Implement proper DNS resolution through CoreDNS and establish firewall rules that allow necessary ports while blocking unauthorized access to Jenkins management interfaces and build agents.
Implementing RBAC permissions for Jenkins pods
Role-Based Access Control limits Jenkins pod permissions to essential Kubernetes operations. Create service accounts with specific roles for Jenkins controllers and dynamic agent provisioning. Define ClusterRoles that allow Jenkins to create, list, and delete pods while restricting access to sensitive resources. Apply the principle of least privilege by granting only necessary permissions for CI/CD pipeline operations and agent management.
Implementing Dynamic Agent Provisioning
Configuring Kubernetes plugin for automatic pod creation
The Jenkins Kubernetes plugin transforms your CI/CD pipeline by automatically spinning up build agents as pods on demand. Install the plugin through Jenkins’ plugin manager, then configure it by adding your Kubernetes cluster credentials and API server endpoint. Set the namespace where Jenkins will create pods, typically “jenkins” or “ci-cd”. Configure service account permissions to allow pod creation, deletion, and monitoring. The plugin connects to your cluster using kubeconfig files or service account tokens, enabling seamless Jenkins Kubernetes integration for dynamic agent provisioning.
Setting up pod templates for different build environments
Pod templates define the blueprint for your Jenkins dynamic agents, specifying container images, resource requirements, and environment configurations. Create separate templates for different build scenarios – one for Node.js applications using node:16 images, another for Java builds with maven:3.8-openjdk-11, and specialized templates for Docker builds with docker-in-docker capabilities. Configure volume mounts for shared workspaces, secret mounting for credentials, and environment variables for build-specific settings. Each template should include labels that match your pipeline job requirements, ensuring the right environment gets provisioned automatically.
Managing resource limits and requests for optimal performance
Resource management prevents build pods from overwhelming your Kubernetes cluster while ensuring adequate performance. Set CPU requests at 100-500m and limits at 1-2 cores per agent, with memory requests of 512Mi-1Gi and limits of 2-4Gi depending on build complexity. Configure resource quotas at the namespace level to prevent runaway builds from consuming all cluster resources. Use node affinity rules to schedule resource-intensive builds on appropriate nodes, and implement pod disruption budgets to maintain build stability during cluster maintenance. Monitor resource utilization patterns to fine-tune these settings over time.
Establishing agent lifecycle management and cleanup policies
Proper lifecycle management ensures your cluster stays clean and cost-effective. Configure automatic pod deletion after build completion with a retention period of 5-10 minutes to allow log collection. Set idle timeout policies to terminate agents that remain inactive for extended periods, typically 10-15 minutes. Implement cleanup jobs using Kubernetes CronJobs to remove failed or stuck pods that weren’t properly cleaned up. Configure pod security contexts and network policies to isolate build environments. Use resource monitoring to track agent usage patterns and adjust provisioning strategies, ensuring optimal performance while minimizing resource waste in your Jenkins Kubernetes scaling implementation.
Optimizing Build Performance with Smart Caching Strategies
Implementing Distributed Cache Volumes Across Agents
Creating shared cache volumes across Jenkins dynamic agents on Kubernetes dramatically reduces build times by eliminating redundant downloads. Configure PersistentVolumes with ReadWriteMany access modes to enable multiple agents to simultaneously access cached artifacts. Use NFS or cloud-native storage solutions like AWS EFS to maintain cache consistency across different nodes, ensuring Maven, npm, or Gradle dependencies remain accessible regardless of which agent handles the build.
Leveraging Persistent Volume Claims for Workspace Sharing
Persistent Volume Claims (PVCs) enable Jenkins agents to share workspace data efficiently across builds and agent instances. Create dedicated PVCs for commonly used workspaces, allowing builds to resume from previous states without starting from scratch. This approach particularly benefits monorepo projects where multiple pipelines access shared codebases, reducing checkout times and enabling incremental builds that only process changed components.
Configuring Docker Layer Caching for Containerized Builds
Docker layer caching significantly accelerates containerized builds by reusing unchanged layers across builds. Configure Docker-in-Docker (DinD) with shared cache volumes or use Kaniko for rootless container builds with persistent cache storage. Mount cache volumes to /var/lib/docker for DinD setups or configure Kaniko’s cache directory to point to persistent storage, enabling layer reuse across different Jenkins agents and build sessions.
Setting Up Dependency Caching for Faster Build Times
Smart dependency caching prevents repeated downloads of packages and libraries across builds. Configure language-specific cache strategies by mounting persistent volumes to dependency directories like .m2 for Maven, node_modules for Node.js, or .gradle for Gradle projects. Use cache keys based on dependency file checksums (pom.xml, package.json, build.gradle) to ensure cache invalidation when dependencies change while maximizing reuse for unchanged configurations.
Scaling Jenkins Horizontally for High Availability
Deploying multiple Jenkins masters with load balancing
Setting up Jenkins horizontal scaling on Kubernetes requires deploying multiple Jenkins masters behind a load balancer to distribute incoming requests and prevent single points of failure. Deploy each Jenkins master as a separate StatefulSet with persistent volumes for configuration data, then configure an Ingress controller or Kubernetes Service with session affinity to ensure consistent user sessions. Container orchestration platforms like Kubernetes make this seamless by automatically managing master pod lifecycles and health checks.
Implementing cluster-wide job distribution algorithms
Smart job distribution across Jenkins masters maximizes resource utilization and prevents bottlenecks. Implement queue-based algorithms that consider factors like agent availability, build complexity, and historical execution times. Configure Jenkins plugins like the Multi-Master Plugin or custom webhook integrations to route builds based on project labels, resource requirements, and current cluster load. This ensures optimal workload distribution across your Jenkins horizontal scaling infrastructure.
Configuring automatic scaling based on build queue metrics
Dynamic scaling responds to build demand by monitoring queue depth and agent utilization metrics. Set up Horizontal Pod Autoscaler (HPA) rules that trigger new Jenkins master instances when build queues exceed thresholds or when existing masters reach capacity limits. Configure custom metrics from Jenkins API endpoints to drive scaling decisions, ensuring your Kubernetes CI/CD pipeline scales efficiently during peak development periods while conserving resources during quiet times.
Managing cross-cluster build artifact synchronization
Artifact synchronization across multiple Jenkins masters requires shared storage solutions and coordination mechanisms. Implement distributed storage using Kubernetes persistent volumes with ReadWriteMany access modes or external storage services like S3 or NFS. Configure artifact retention policies and cleanup jobs to prevent storage bloat while ensuring build dependencies remain accessible across all cluster nodes. This maintains consistency in your Jenkins high availability Kubernetes setup.
Monitoring and Troubleshooting Jenkins Performance
Setting up Prometheus metrics collection for Jenkins
Jenkins exposes comprehensive metrics through the Prometheus plugin, enabling deep visibility into your Kubernetes CI/CD pipeline performance. Install the Prometheus metrics plugin and configure it to expose build statistics, queue depths, executor utilization, and system health metrics. The plugin automatically creates endpoints at /prometheus that capture critical Jenkins performance optimization data including build duration, success rates, and resource consumption patterns essential for Jenkins Kubernetes scaling decisions.
Configure the metrics collection by adding Prometheus annotations to your Jenkins deployment manifest:
metadata:
  annotations:
    prometheus.io/scrape: "true"
    prometheus.io/port: "8080"
    prometheus.io/path: "/prometheus"
Key metrics to monitor include:
- Build execution times and throughput
- Dynamic agent provisioning rates
- Queue wait times and build backlogs
- Memory and CPU utilization across pods
- Plugin performance and error rates
Creating Grafana dashboards for build pipeline visibility
Design comprehensive Grafana dashboards that visualize Jenkins dynamic agents performance across your Kubernetes cluster. Create panels displaying real-time build pipeline metrics, agent utilization rates, and resource allocation patterns. Focus on tracking build success rates, average execution times, and queue management efficiency to identify bottlenecks in your Jenkins horizontal scaling setup.
Essential dashboard components include:
| Dashboard Panel | Metrics Tracked | Purpose |
|---|---|---|
| Build Overview | Success rate, failure count, duration trends | Pipeline health monitoring |
| Agent Management | Active agents, provisioning time, resource usage | Dynamic scaling insights |
| Queue Analysis | Job wait times, queue depth, throughput | Performance bottleneck detection |
| Resource Utilization | CPU, memory, storage consumption | Infrastructure optimization |
Build custom queries using PromQL to aggregate data from multiple Jenkins instances:
rate(jenkins_builds_duration_milliseconds_summary_sum[5m])
jenkins_queue_size_value
jenkins_executor_in_use_value / jenkins_executor_count_value
Implementing alerting for failed builds and resource constraints
Configure intelligent alerting rules that trigger on critical Jenkins performance optimization issues and resource constraints in your Kubernetes environment. Set up multi-tiered alerts covering build failures, agent provisioning delays, resource exhaustion, and queue congestion. Use Prometheus AlertManager to route notifications through multiple channels including Slack, email, and PagerDuty for immediate incident response.
Critical alerting scenarios:
- Build Failure Spike: Alert when failure rate exceeds 15% over 10 minutes
- Agent Provisioning Delays: Trigger alerts when dynamic agent startup times exceed 5 minutes
- Resource Exhaustion: Monitor CPU/memory usage above 85% for sustained periods
- Queue Buildup: Alert when job queue depth grows beyond normal thresholds
Sample alert configuration:
groups:
- name: jenkins-alerts
  rules:
  - alert: HighBuildFailureRate
    expr: rate(jenkins_builds_failure_total[10m]) > 0.15
    for: 5m
    annotations:
      summary: "Jenkins build failure rate is high"
      description: "Build failure rate is {{ $value }} over the last 10 minutes"
Implement escalation policies that automatically scale Jenkins Kubernetes resources when performance thresholds are breached, ensuring your CI/CD pipeline maintains optimal throughput during peak demand periods.
Dynamic Jenkins scaling on Kubernetes transforms how development teams handle CI/CD workloads. By setting up Jenkins with dynamic agent provisioning, implementing smart caching strategies, and building horizontal scaling capabilities, teams can achieve faster build times and better resource utilization. The combination of automated monitoring and proactive troubleshooting keeps your Jenkins environment running smoothly even during peak development cycles.
Ready to supercharge your Jenkins setup? Start with dynamic agents to handle varying workloads, then layer in intelligent caching to speed up your builds. Your development team will thank you for the faster feedback loops, and your infrastructure costs will reflect the improved efficiency. Take the first step today by evaluating your current Jenkins bottlenecks and planning your Kubernetes migration strategy.


